
 Home
Home News
News
- 1 SNDL stock price is approaching its 3-year low at $1.38 which may act as support.
- 2 SNDL stock price is trading below 200- and 50-day EMAs indicating downtrend.
- 3 SNDL Inc (NASDAQ: SNDL) is set to release its Q4 earnings report on April 4, 2023.
SNDL stock price is down by 28% on a monthly basis and is trading below the 50- and 200-day EMAs indicating a downtrend. However, SNDL stock is approaching the 3 year low at $1.38 which could be a strong demand zone. Currently, SNDL Inc (NASDAQ: SNDL) stock price closed the previous session at $1.53 with intraday gains of 0.66% and market capitalization stands at $398.87 million.
SNDL stock price was stuck in the range between $2.00 to $3.00 for a long time and was being traded with a bearish bias. At the beginning of January, SNDL stock bulls tried to show some positive recovery from the lower range but the 50-day EMA acted as resistance and prices faced rejection. Later, overall market sentiment turned bearish and sadly SNDL stock broke down the lower range support which invited further decline. Therefore, $2.00 will now act as an immediate hurdle in the coming days.
Will SNDL stock trigger a relief rally?
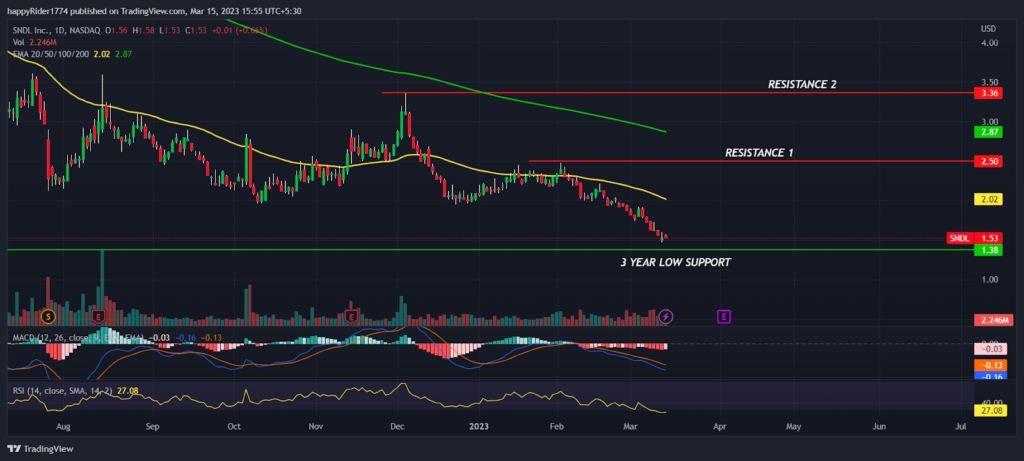
SNDL stock price was falling over the past 15 consecutive days forming a lower low candle indicating bearishness. However, the price is very close to its 3-year low which seems to be the last level of support for its long term investors. On the other hand, fourth quarter earnings are scheduled in the coming week and if SNDL’s figures meet analysts’ estimates, then we might see a short term relief rally. Technical indicators of SNDL stock like MACD had generated a negative crossover indicating bearishness to continue for some more time. The Relative strength at 27 denotes prices are oversold and anytime it may trigger short term pull back from the lower levels.
SNDL Inc – Q4 revenue estimate
SNDL Inc (NASDAQ: SNDL) is set to release its fourth quarter results on April 4, 2023 and analysts expect a revenue of around $175.85 million. If the revenue estimates are met and overall market sentiment improves, then we may expect a positive turnaround. Technical analysis suggests that SNDL stock is in downtrend and the probability of a sharp bounce back remains low.
Conclusion
SNDL stock is down by 28% on a monthly basis and is slipping down, forming lower low swings indicating bearishness. However, the 3-year low, around which the price now hovers, might act as an important support level for the bulls. Technical analysis suggests SNDL stock price is in bearish grip and any short term surge will have low probability of giving follow up momentum.
Technical levels
Resistance levels : $2.00 and $2.50
Support levels : $1.38 and $1.00
Disclaimer
The views and opinions stated by the author, or any people named in this article, are for informational purposes only, and they do not establish financial, investment, or other advice. Investing in or trading crypto assets comes with a risk of financial loss.

Nancy J. Allen is a crypto enthusiast, with a major in macroeconomics and minor in business statistics. She believes that cryptocurrencies inspire people to be their own banks, and step aside from traditional monetary exchange systems. She is also intrigued by blockchain technology and its functioning. She frequently researches, and posts content on the top altcoins, their theoretical working principles and technical price predictions.


