
 Home
Home News
News

- The current price of the coin is around $6.27 with a total loss of 0.94% during the intraday trading session
- The pair of DOT/BTC is surfing around 0.0003277 BTC with a drop of 1.07% in the last 24 hours
- The price is trading below the 20,50,100 days of the Exponential Moving Average. And is lagging behind 200 days of the Daily Moving Average.
The Polkadot is currently in a bullish trend the coin’s price is steadily moving in an uptrend. The sellers are attempting to get a grip over the DOT but the bulls are crushing their shot to enter the trade. If the bears push themselves they might acquire the market of Polkadot cryptocurrency.

Currently, the price of Polkadot is hovering around $6.27, showing a loss of 0.97% during the intraday trading session. This indicates that the bulls are still in control and may push the price toward the primary resistance level of $6.70 and even break through to the secondary resistance level of $7.56. The bears are struggling to bring the price down to their desired zone, but the bulls are fighting back to maintain their hold on the market.

If the bears fail to bring the price down, it will be a significant win for the bulls, and they may continue to push the price higher. However, if the bears manage to gain control, it could lead to a crisis for the bulls. If the bears acquire the market of DOT, the price might break through the primary support level of $5.38 and decline toward the secondary support level of $4.25.
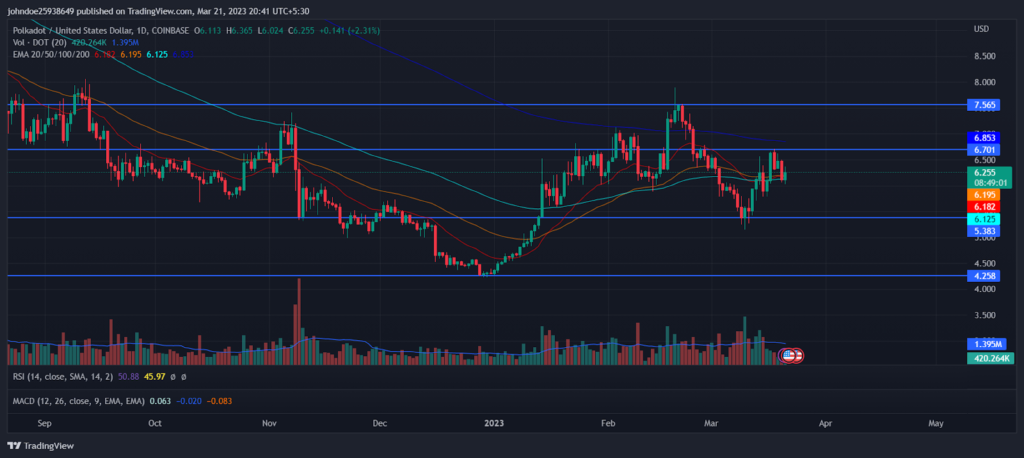
In terms of volume, there has been a drop of approximately 3.90% during the last intraday trading session, indicating that short-selling pressure has increased, but the buyers are still exerting enough pressure to maintain the upward trend. The Polkadot price is trading above the 20,50,100 days of the Exponential Moving Average. And is lagging behind 200 days of the Daily Moving Average.
Exploring the technical Indicators of DOT
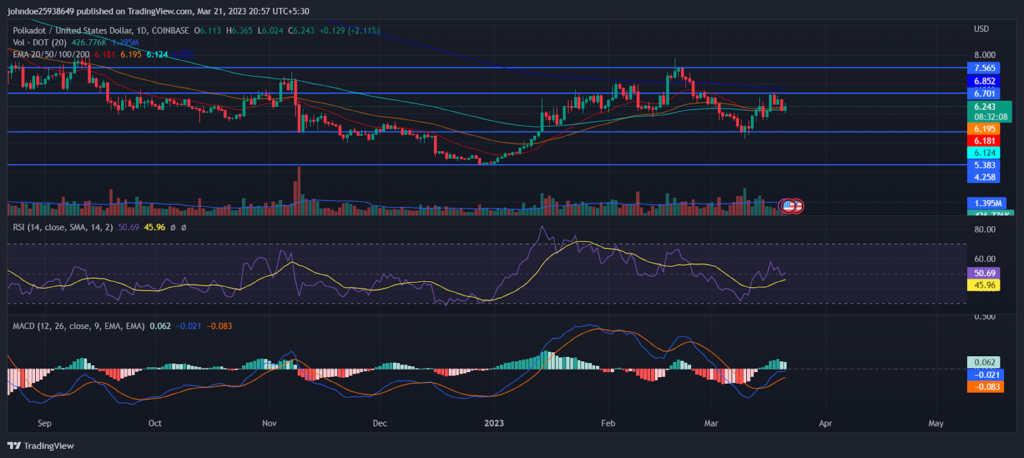
The technical indicator shows the following The intersection of the MACD and MACD signal indicates a positive crossover. The relative strength index is at neutrality. The RSI’s current value is 50.69 which is above its average RSI of 45.96. The RSI might move toward the overbought zone if the bulls acquire the trade. Investors are getting attracted to Polkadot crypto.
Conclusion
The current market trend of Polkadot is bullish the increasing price of the coin indicates the accumulation of buyers. The sellers might attempt to get into trade the trend might get reversal if bears dominate trade. The volume has also decreased indicating increasing selling pressure. The current price of the coin is around $6.28 with a total loss of 0.94% during the intraday trading session.
Technical Levels
Support Levels: $6.70 and $7.56
Resistance Levels: $7.81 and $9.54
Disclaimer
The views and opinions stated by the author, or any people named in this article, are for informational ideas only. They do not establish financial, investment, or other advice. Investing in or trading crypto assets comes with a risk of financial loss.
Steve Anderson is an Australian crypto enthusiast. He is a specialist in management and trading for over 5 years. Steve has worked as a crypto trader, he loves learning about decentralisation, understanding the true potential of the blockchain.


