
 Home
Home News
News

- Polkadot price prediction suggests a rise if certain conditions are met.
- It is trading below the 200 day EMA, but struggles to hold a 50 day EMA.
- DOT price has recovered approximately 20% from the low swing at $5.150.
Polkadot (DOT) price prediction favors the bulls and suggests a positive recovery to continue into the coming months. It has recovered approximately 20% from the recent low swing at $5.150 and formed a bullish reversal pattern. However, the confirmation of the trend reversal will come when the price is able to sustain above both the EMAs. DOT price seems to be struggling to defend the 50 day EMA, which showcases active strong bears on the higher levels.

Polkadot is trading at $6.012 with an intraday rise of 1.81% and 24 hour volume to market cap ratio stands at 0.0167. The DOT/BTC pair is trading at 0.00021789 with an intraday rise of 1.32%, which shows minor correlation between direction of both the pairs. In mid-February, DOT price broke out of its narrow range consolidation between $6.00 to $7.00 and hit a high of $7.900. It also attempted to sustain above the 200 day EMA to turn the positional trend in the direction of bulls.

But DOT failed to hold the higher levels and faced strong rejection from the supply zone. The price started to decline by forming lower low candles and reversed the trend in the downward direction. At the beginning of March, the Polkadot price broke the lower range support of $6.00 and also slipped below the 50 day EMA, which prompted further decline.
Polkadot Price Defends the $5.00 Demand Zone
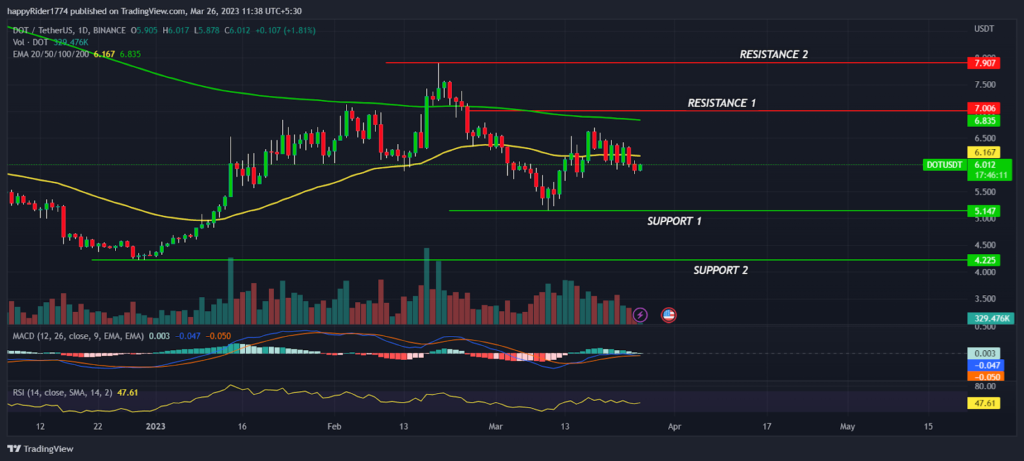
DOT fell by approximately 35% from the recent peak at $7.900 and almost lost all its previous gains. Luckily, the global market sentiment improved in mid-March and DOT price witnessed some genuine buying from its demand zone at $5.00. Presently, the altcoin is trying to push above the $6.00 level, but the 50 day EMA is acting as a strong hurdle.
However, the DOT price saw a decent bounce with a spike in the buying volume showing that bulls are coming back.The probability of it reaching $8.00 remains high, that is, if the price is able to trade above 50 and 200 day EMA in the coming months.
Will DOT Price Continue to Rise?
DOT price seems to be highly correlated with the overall market and if market sentiment remains bullish, then DOT is expected to continue the upward momentum. Technical indicators, like MACD, have generated positive crossover but lacked momentum indicating prices are likely to trade in the range. The Relative Strength Index (RSI) at 47 sloping sideways denotes neutral sentiment between buyers and sellers.
Conclusion
Polkadot price prediction is bullish and suggests a rise in the coming months. The technical analysis says that the probability of reaching $8.00 remains high if the DOT price is able to regain the 50 and 200 day EMA. Till then, DOT is expected to trade in the narrow range.
Technical levels
Resistance levels : $7.000 and $8.000
Support levels : $5.000 and $4.225
Disclaimer
The views and opinions stated by the author, or any people named in this article, are for informational purposes only, and they do not establish financial, investment, or other advice. Investing in or trading crypto assets comes with a risk of financial loss.

Nancy J. Allen is a crypto enthusiast, with a major in macroeconomics and minor in business statistics. She believes that cryptocurrencies inspire people to be their own banks, and step aside from traditional monetary exchange systems. She is also intrigued by blockchain technology and its functioning. She frequently researches, and posts content on the top altcoins, their theoretical working principles and technical price predictions.


