
 Home
Home News
News

- The price of SAND is trading below the 20,50,100,200 days of Daily Moving Average.
- The current price of the SAND is currently surfing around $0.6028 and has dropped by 0.21% during the intraday trading session
- The pair of SAND/BTC is around 0.00002231 BTC and has raised by 1.80% in the last 24 hours
Since the beginning of 2023, the SAND market has been experiencing an upward trend, with a consistent rise in price and momentum. This growth in value is drawing the attention of investors. However, as the bullish rally appears to be coming to a close, there are efforts from bears to manipulate the market of the Sandbox.

The price of the Sandbox crypto has been decreasing recently, likely due to bearish market manipulation. The current price of the coin is around $0.6028 with a drop of 0.21%. The coin had been steadily increasing in value but is now approaching its primary support level of $0.5315, and if bearish activity persists, it could fall to the secondary support level of $0.3827. However, there is also potential for an upward trend as the bulls are trying to drive the price back up. If this occurs, the coin could reach its primary resistance level of $0.6865, and if the bullish rally continues, it could even reach the secondary resistance level of $0.8354. It is crucial for the Sand coin to recover and regain its potential for long-term survival.

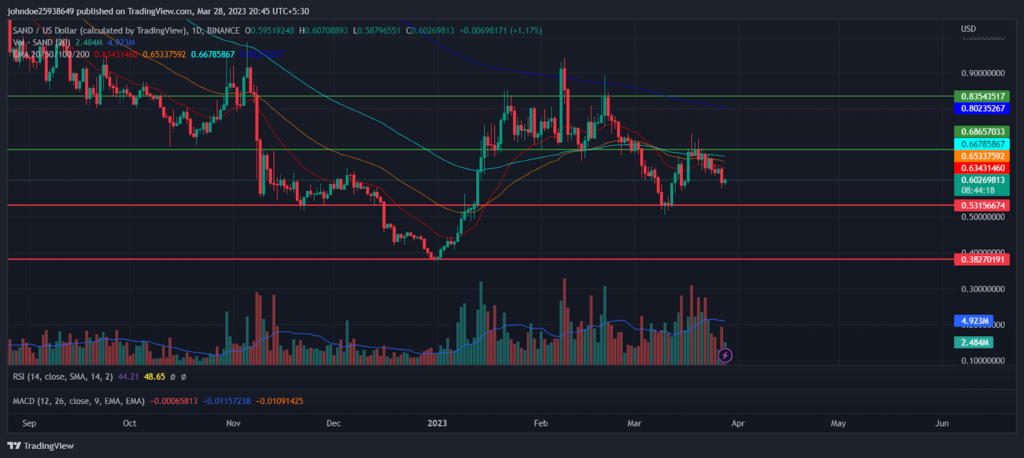
The SAND’s volume has inclined by about 25.57%. Around 0.1371 is the volume-to-market cap ratio. The increasing volume clearly demonstrates the buyers are trying to put some pressure, which implies decreasing selling pressure. The price is trading below the 20,50,100,200 days of Daily Moving Average.
The Technical Indicators of SAND
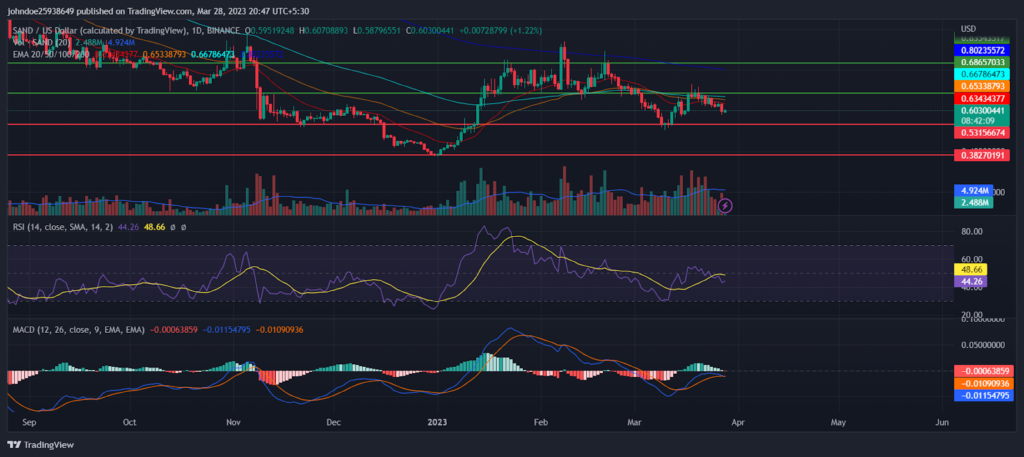
The RSI of the Sandbox is currently in an oversold zone which indicates that sellers are coming in the majority and taking over the market. And it seems that the RSI might rebound towards neutrality. The current RSI is around 44.26 which is below the average RSI of 48.66.
The MACD and MACD signals are intersecting and show signs of negative crossover which gives the opportunity for traders to enter the market. Investors are eagerly waiting for any movement over the daily price chart.
Conclusion
The current market trend of the SAND was bullish. The coin might reverse the trend as the sellers attempt to get into the trade. The current price of Sandbox is $0.6028 and has dropped by 0.21% during the intraday trading session. The increasing volume clearly demonstrates the buyers are trying to put some pressure. The investors must wait for any directional change over the daily price chart.
Technical Levels-
Resistance level- $0.6865 and $0.8354
Support level- $0.5315 and $0.3827
Disclaimer-
The views and opinions stated by the author, or any people named in this article, are for informational purposes only, and they do not establish financial, investment, or other advice. Investing in or trading crypto assets comes with a risk of financial loss.
Steve Anderson is an Australian crypto enthusiast. He is a specialist in management and trading for over 5 years. Steve has worked as a crypto trader, he loves learning about decentralisation, understanding the true potential of the blockchain.


