
 Home
Home News
News

- Chainlink price prediction suggests the recovery of LINK crypto inside the long term consolidation phase over the daily time frame chart.
- LINK crypto is trying to recover above 20, 50, 100 and 200-days Daily Moving Average.
- The pair of LINK/BTC was at 0.0002584 BTC with an increase of 1.66%.
Chainlink price prediction indicates that LINK cryptocurrency is still in its uptrend phase during the consolidation period of the daily time frame chart. Over the daily time frame chart, LINK cryptocurrency has been consolidating inside the region that is limited by a horizontal price range.

The price of Chainlink has been varying between $5.70 and $9.55. To keep the upward pattern going, Chainlink needs to draw more buyers during the intraday trading session. Analysts predict that the price of LINK cryptocurrency may rise towards the upper price range and then rebound up to the $10 resistance level.

Chainlink price was $7.33 and during the day’s trading session, it increased by 5.59% in market value. The intraday trading session saw a 46.10% rise in trading volume. This indicates that buyers are attempting to move LINK crypto towards the phase’s upper price range. Market capitalization to volume was 0.07731.
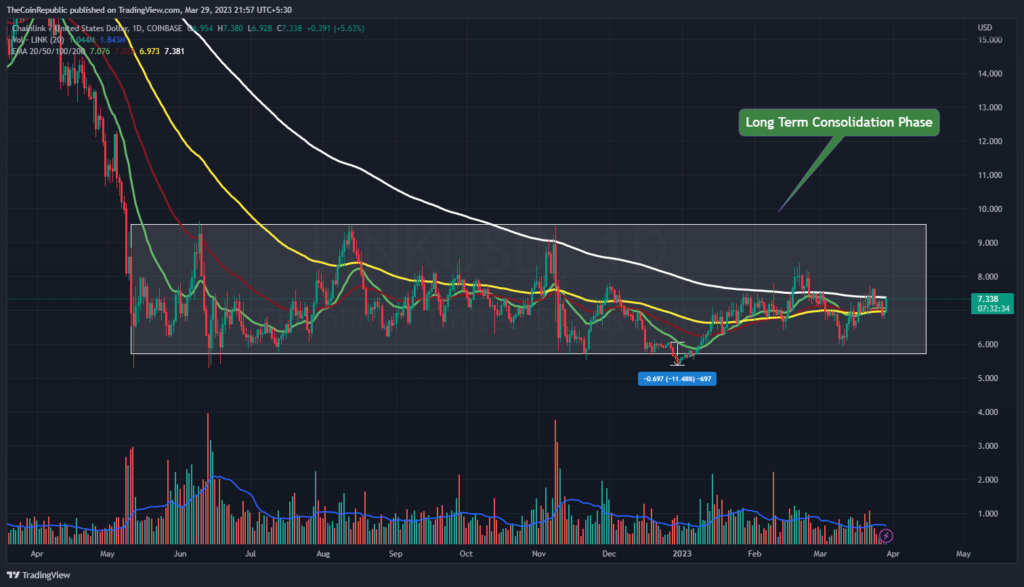
Chainlink’s price prediction shows how the LINKc cryptocurrency has been consolidating since May 2022. To advance towards the higher price range of the consolidation phase, LINK crypto must maintain its present rate of growth. The trading volume must increase throughout the day’s trading session, though it is still below normal. Meanwhile, LINK crypto is trying to recover above 20, 50, 100 and 200-days Daily Moving Average.
Chainlink Price Prediction: Technical Indications!
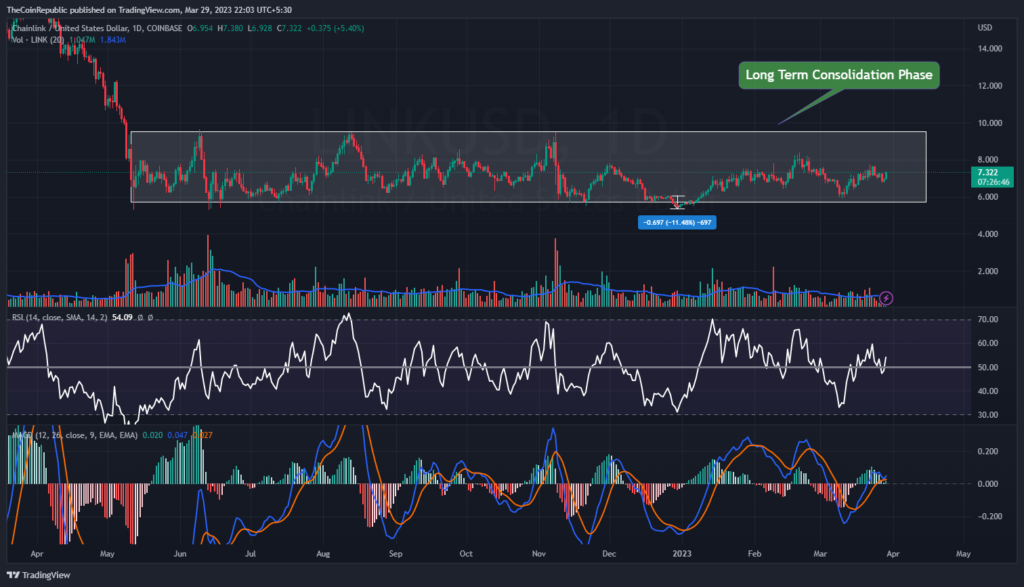
Chainlink price prediction indicates an upward tendency for the LINK cryptocurrency within the daily time frame chart’s horizontal range-bound region. Technical indicators point to the LINK cryptocurrency’s upward trajectory.
The relative strength indicator displays the price of LINK’s uptrend momentum. At 54, the RSI was heading in the direction of the overbought zone. Chainlink’s price rising velocity is visible in MACD. After a positive crossing, the MACD line is higher than the signal line. Chainlink cryptocurrency investors need to monitor whether the LINK cryptocurrency price holds at the higher price level and note its breakout.
Summary
Chainlink price prediction indicates that LINK cryptocurrency is still in its uptrend phase during the consolidation period of the daily time frame chart. To advance towards the higher price range of the consolidation phase, LINK crypto must maintain its present rate of growth.Technical indicators point to the LINK cryptocurrency’s upward trajectory.
Technical Levels
Support Levels: $7.00 and $6.75
Resistance Levels: $7.70 and $8.50
Disclaimer
The views and opinions stated by the author, or any people named in this article, are for informational purposes only, and they do not establish financial, investment, or other advice. Investing in or trading crypto assets comes with a risk of financial loss.

Nancy J. Allen is a crypto enthusiast, with a major in macroeconomics and minor in business statistics. She believes that cryptocurrencies inspire people to be their own banks, and step aside from traditional monetary exchange systems. She is also intrigued by blockchain technology and its functioning. She frequently researches, and posts content on the top altcoins, their theoretical working principles and technical price predictions.


