
 Home
Home News
News
- The CFX price is currently trading at the $0.4188 level while seeing a change of -34.29 % in 24-hour trading volume.
- The CFX price is observing a decline of 0.32% in the last 24 hours.
The Investor’s sentiments regarding the CFX price have been on the bullish side for the last couple of days despite the recent bearish turn of events in the overall market where the sellers overpowered the markets. Although as of now the ongoing price action is suggesting that the price can take a bearish correction in the near future while the oscillators are also supporting this statement. However, as the overall price is currently trading above all the major EMA’s the primary trend of the CFX price is bullish.
As our analysts predicted in the previous analysis regarding the CFX price taking a bearish correction. Near Mid February our analyst suggested that after taking resistance from the $0.3500 price CFX price can take a rejection of 60 percent according to the bearish candlestick pattern and the overbought levels indicated by the oscillators. This was proven correct when the price after taking rejection from $0.3500 gave an exact downfall of 60 percent.
(Daily Timeframe)
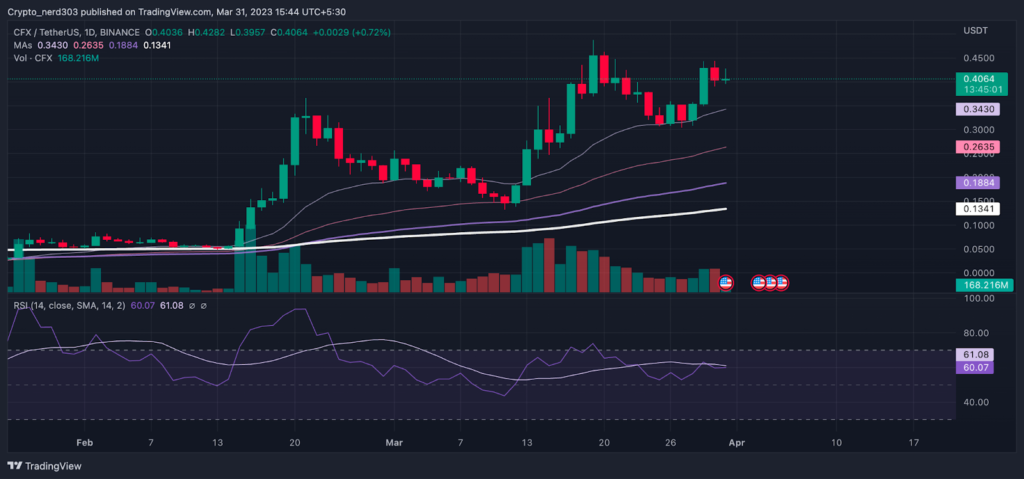
Although after taking a downfall of 60 percent the CFX price took support from its 50 EMA the price made a bullish engulfing candle and gained more than 95 percent of its value. Although after taking resistance from $0.4500 the price made a bearish correction of 35 percent and after consolidating for a while above the 20 EMA the price made another bullish candlestick pattern while making a 40 percent bull run.
The overall market sentiments are currently trading in the greed zone around 63 in the greed and fear index while seeing an increase of 2 points since the last week when the sentiments were trading around 62 points according to the Alternative(dot)me. While the sellers are currently overwhelming the CFX price across all the major cryptocurrency exchange platforms, by 50 to 52 percent.
Technical Analysis (4-hour Timeframe )
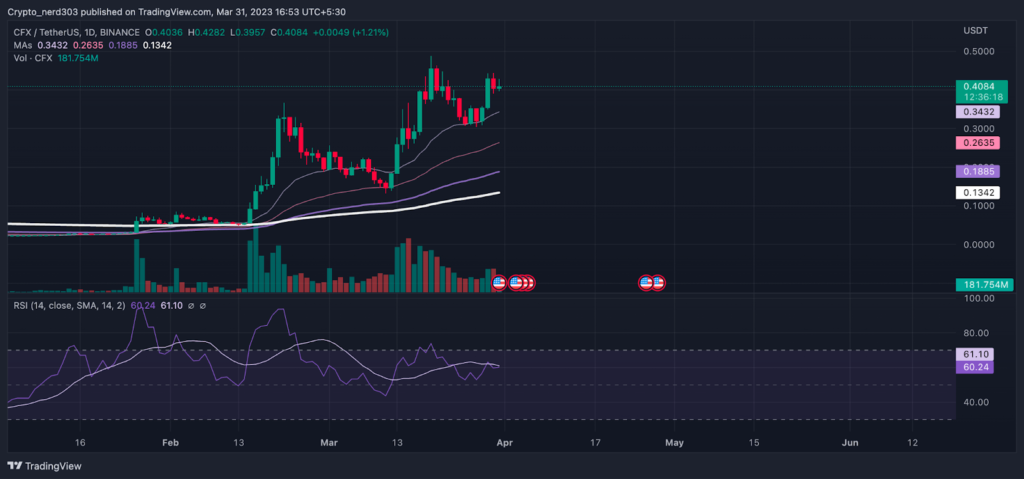
The RSI line is currently taking a divergence from the ongoing price action where the price is making a higher high and higher low pattern the RSI line is making a lower high lower low which indicates that the price can take a bearish turn. The current RSI line currently trending near the oversold zone around 60.24 points taking resistance from the 14 SMA which is trading around 61.10 points.
Technical levels –
Support -$0.3000
Resistance – $0.5000
Disclaimer
The views and opinions stated by the author, or any people named in this article, are for informational purposes only, and they do not establish financial, investment, or other advice. Investing in or trading crypto assets comes with a risk of financial loss.
Steve Anderson is an Australian crypto enthusiast. He is a specialist in management and trading for over 5 years. Steve has worked as a crypto trader, he loves learning about decentralisation, understanding the true potential of the blockchain.


