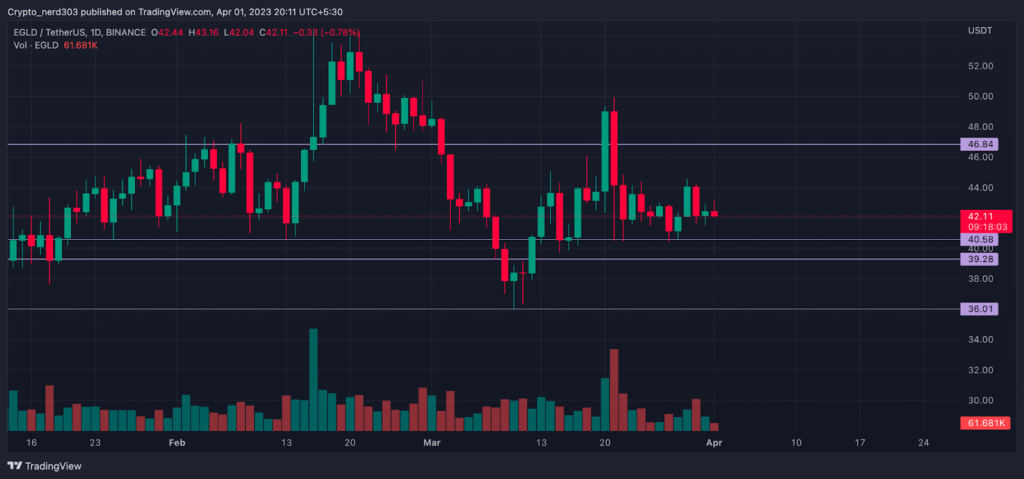
- The EGLD price is currently trading at $42.27 while seeing a change of 25% in 24-hour trading volume.
- The EGLD price is observing a decline of 1.44% in the last 24 hours.
Multiverse is a blockchain protocol that offers extremely fast transaction speed through sharing techniques. It’s a technology ecosystem for the new internet which includes Fintech and Decentralized finance (Defi). The execution platform of Multiverse smart contracts is extremely capable it can execute 15000 transactions per second. It can be done with 6-second latency at a $0.001 transaction cost.
According to the analysis given by our analysts in the previous analysis, the EGLD price after crossing below the $44 level made a bearish correction of 18 percent. In the previous analysis, the price was trading around $44.00. while after crossing below all the major EMA’s and the RSI crossed below the median line after which our analyst predicted the EGLD price may take a bearish correction. This was proven correct when after making a bearish candle the price made a downtrend of 18 percent.
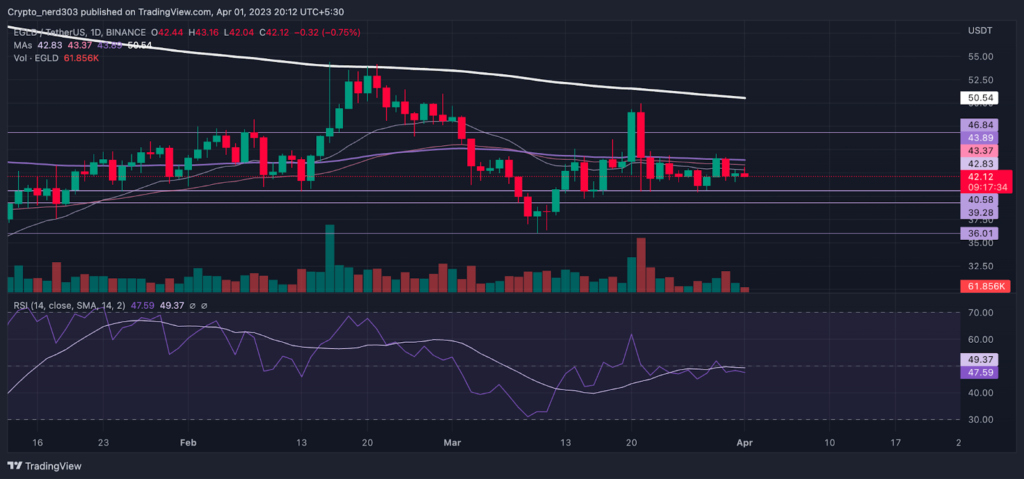
The EGLD price taking resistance from the 200 EMA (Daily Timeframe)

The market sentiments are currently trading near the greed zone around 61 points according to the greed and fear index. Also seeing a decline of 3 points since the last week when the market was around 64 points. As per the Alternative(dot)me platform. The sellers are currently dominating most of the cryptocurrency exchange platforms by 50 to 54%. However, the buyers are maintaining their strong grip on some platforms where they are overwhelming the price action up to 83%.
Technical Analysis ( 1 Day Timeframe )

The EGLD price is currently taking resistance from the 100 EMA trading on a bear trend under the 200 EMA. The 20/50/100 EMA is also making a convergence under the 200 EMA which suggests that the price can make a big movement on either side. Although as the price is trading below the 200 and 100 EMA the chances of it making a bearish trend are more probable. The price is also making a consolidation with the convergence which supports the probability of sizable movement.
The RSI line is moving near the median line below the 14 SMA indicating that the RSI line may start moving towards the oversold levels around 30 RSI. The current RSI value is 47.59 points whereas the 14 SMA is trending just above it near 49.37 points. The downward curve of the RSI line is presenting a bearish outlook.
Technical levels –
Support -$39.28
Resistance – $50.54
Disclaimer
The views and opinions stated by the author, or any people named in this article, are for informational purposes only, and they do not establish financial, investment, or other advice. Investing in or trading crypto assets comes with a risk of financial loss.

Nancy J. Allen is a crypto enthusiast, with a major in macroeconomics and minor in business statistics. She believes that cryptocurrencies inspire people to be their own banks, and step aside from traditional monetary exchange systems. She is also intrigued by blockchain technology and its functioning. She frequently researches, and posts content on the top altcoins, their theoretical working principles and technical price predictions.


 Home
Home News
News


