
 Home
Home News
News
- CVX price is currently trading at $5.22.
- The 24-hour trading volume increased by 10%.
- CVX price is observing a decline of 0.09% in the last 24 hours.
Presently, investor sentiments regarding CVX price are slightly bearish. That might change soon as the price is making a bullish descending flag and pole pattern. This pattern is usually observed at the beginning or the continuation of a bull trend. This pattern is also supported by the oscillators where the RSI is making a bullish divergence. CVX price recently made a bull trap around mid-November.
Bull trap refers to a situation where the price shows a sudden increase without any credible reason because of which more buyers start stepping into the action. This bullish fever ends immediately because the sellers start stepping in as soon as the buyers realize that the price is showing unnatural price action. The picture presented below shows the bull trap made around mid-November where the CVX price made a candle wick of more than 95% in just a few hours.
CVX Price Trading in a Descending Channel (1-Day Timeframe)
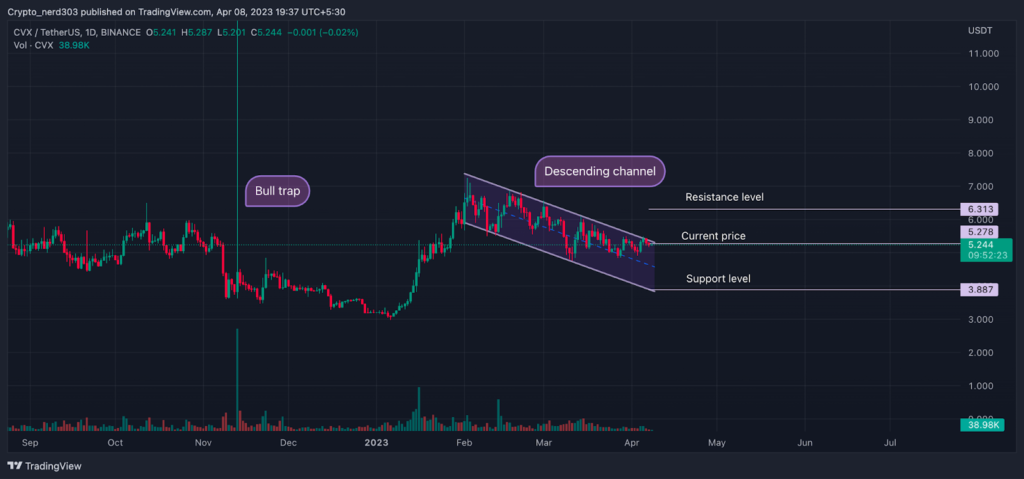
CVX price, after making its bull trap, started trading under a descending consolidation phase. Around Early January, the price made another bullish move. Although this bull trend was supported by a steady increase in volumes and a bullish candlestick pattern. After taking support from the $3.00 level, the price made a bullish hammer and three white soldier patterns. Following this, it made an extremely bullish rally of more than 95%.
After reaching the $7.00 level, the sellers started stepping into the price action. CVX price took a sharp rejection from $7.00 and made its first lower low. Following this, it started trading within a descending channel and made a downturn of 36%.
Technical Analysis ( 1 Day Timeframe )
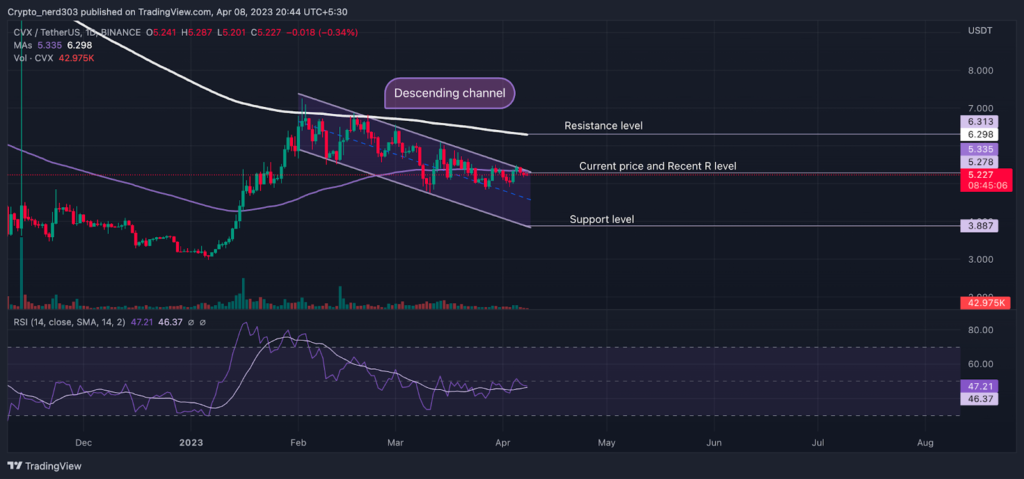
The current price action suggests that the price can take a bearish correction in the short term. The price is trading near the recent resistance level around $6.313 near the 100 EMA. The 200 EMA is trading just above the current price level, which can prove to be another critical resistance. If the price takes resistance from the current level, it can make a correction of 10% where its major support level is 36% below the current price.
The RSI line is at present giving bullish indications. The RSI line is taking support from the 14 SMA near the median level. Current value of RSI is 47.21 points and the 14 SMA line is at 46.37 points.
Technical levels –
Support -$3.900
Resistance – $5.355 and $6.313
Disclaimer
The views and opinions stated by the author, or any people named in this article, are for informational purposes only, and they do not establish financial, investment, or other advice. Investing in or trading crypto assets comes with a risk of financial loss.

Andrew is a blockchain developer who developed his interest in cryptocurrencies while pursuing his post-graduation major in blockchain development. He is a keen observer of details and shares his passion for writing, along with coding. His backend knowledge about blockchain helps him give a unique perspective to his writing skills, and a reliable craft at explaining the concepts such as blockchain programming, languages and token minting. He also frequently shares technical details and performance indicators of ICOs and IDOs.


