
 Home
Home News
News
- 1 The XDC price is currently trading at $0.420 while seeing a change of -4.23% in 24-hour trading volume.
- 2 The XDC price has been observing a decline of 0.48% in the last 24 hours.
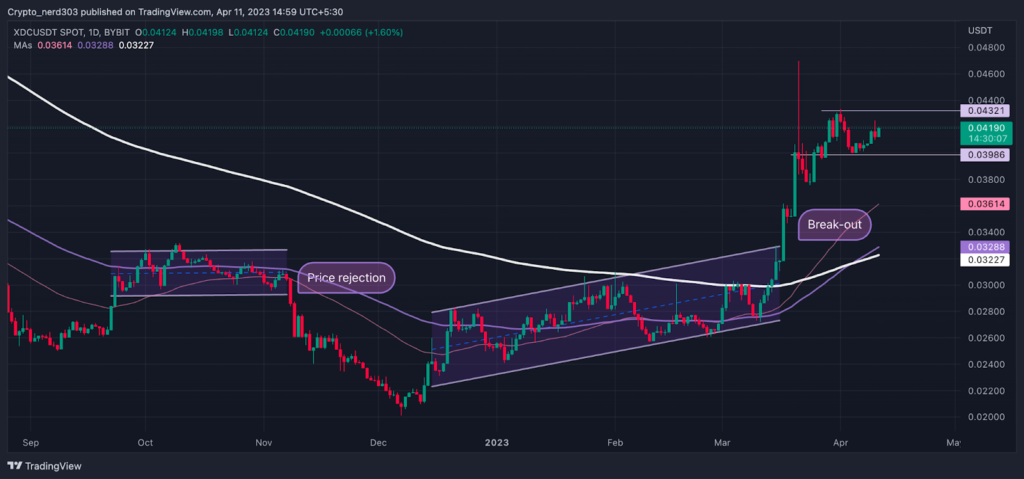
XDC’s price recently made a bullish breakout above the 200 EMA with solid momentum. In the rally, the price of XDC gained 30% of its overall value. Currently, the buyers seem to be encouraged by the bullish breakout which can be observed by the long candlesticks patterns. These candles represent the buyers’ confidence in the price action, in late March the price made a 3-method bullish trend continuation candlestick pattern. After this, the price took a retest.
XDC price made a bullish breakout on the (Daily Timeframe)
The majority of market sentiments are currently in the greed zone at 68 points, observing a major increase of 6 points within a short span of time. This improvement proclaims a significant increase in buyer interest within a brief period. According to the information provided by the Alternative(dot)me platform, the price is currently seeing a significant increase in buyers.
After facing sharp rejection of 30% from the 100 and 50 EMA in an attempt to make a breakthrough through the critical resistance levels, the XDC price made another persistent attempt to break its barrier after taking support from the $0.02000 price point. After this, the price gained heavy support from the buyers and started moving in an ascending consolidation pattern, attempting to breach the 200 EMA resistance level.
The XDC price was eventually successful in its attempts. Following the breakout, buyers started stepping into the price action which made an extremely bullish rally of 31%.
Technical Analysis ( 1 Day Timeframe )
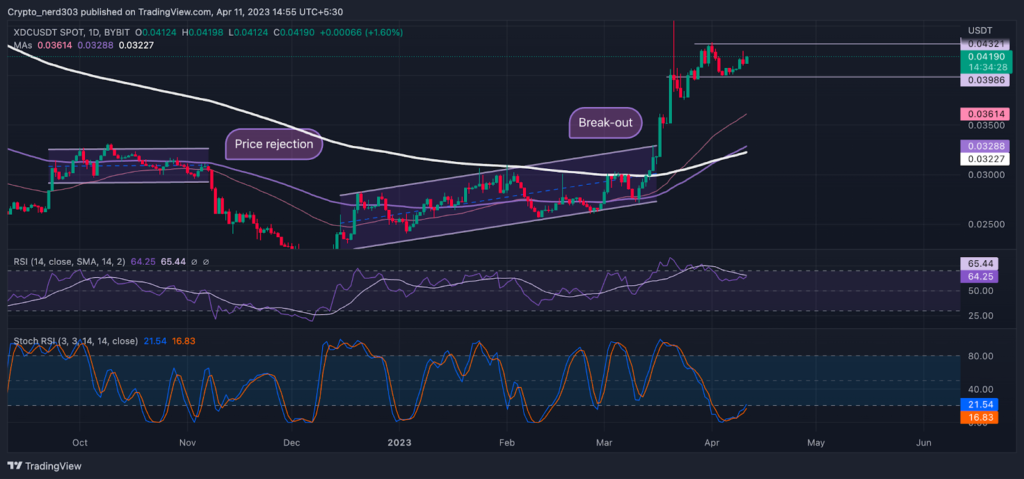
The ocilators are giving bullish indications. The RSI line is moving on an uptrend where the Stochastic RSI is trading near the demand zone, with the price action under the 14 SMA near the median line. The current value of the RSI is 64.25 points which are seeing resistance from the 14 SMA at 65.44 points. The Stochastic RSI is trading at 21.54 points below the demand zone.
Conclusion
According to analysts, the investors are currently showing great optimism regarding XDC price. The Stochastic RSI is giving bullish indications near the demand zone whereas the RSI line is trading near the overbought levels. The next resistance level for XDC is 12% above the current price.
Technical levels –
Support -$110.0
Resistance – $140.0
Disclaimer
The views and opinions stated by the author, or any people named in this article, are for informational purposes only, and they do not establish financial, investment, or other advice. Investing in or trading crypto assets comes with a risk of financial loss.

With a background in journalism, Ritika Sharma has worked with many reputed media firms focusing on general news such as politics and crime. She joined The Coin Republic as a reporter for crypto, and found a great passion for cryptocurrency, Web3, NFTs and other digital assets. She spends a lot of time researching and delving deeper into these concepts around the clock, and is a strong advocate for women in STEM.


