
 Home
Home News
News
- 1 The Internet Computer is currently trading at $5.38 with an increase of 0.02% during the intraday trading session
- 2 The ICP/BTC pair is at 0.000177 BTC with a decrease of 1.20% in the last 24 hours.
- 3 The price is below the 20-day EMA and is lagging behind 50,100,200 days of DMA.
The price of Internet Computer is following upward momentum, indicating a shift away from the previous bearish trend. Currently, ICP is trading at $5.38 with an increase of 0.02% during intraday trading, while the ICP/BTC pair has seen a decline of approximately 1.20% in the last 24 hours.
It is standing at 0.000177 BTC. The market is experiencing a shift towards bullish momentum, and it remains to be seen whether this trend will continue or the bears will take over once again. The current market trend shows the bears losing their hold on ICP’s price, and the buying pressure is increasing.
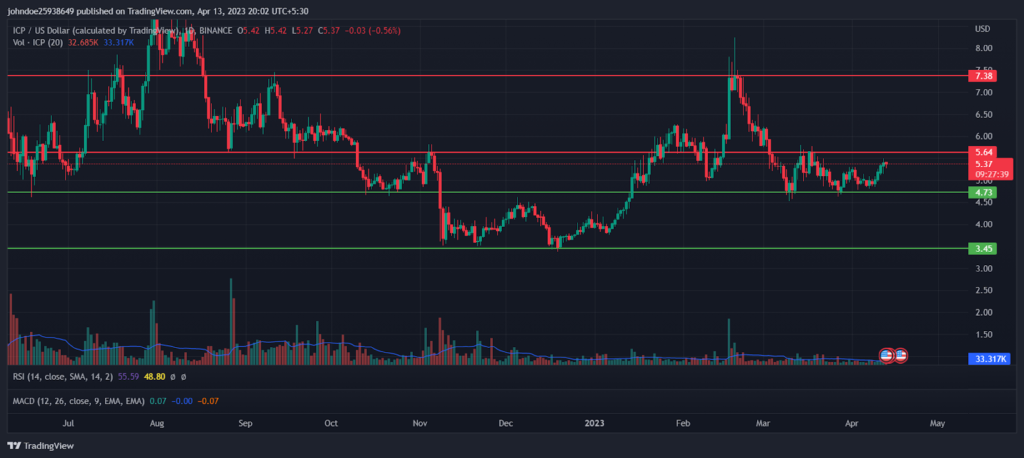
If the bullish trend continues, the coin’s price may reach its primary resistance level of $5.64 or even the secondary resistance level of $7.38. However, if the bears manage to take control of the market, the coin’s price could drop to its primary support level of $4.73. And if this continues, it may even reach its secondary support level of $3.45.
The trading volume for ICP has decreased by 15.23% in the last 24 hours, indicating an increase in selling pressure. This makes it difficult for the bulls to manipulate the market, and the bears stand to benefit from this trend. The volume-to-market cap ratio is 0.0254
The Technical Analysis of ICP
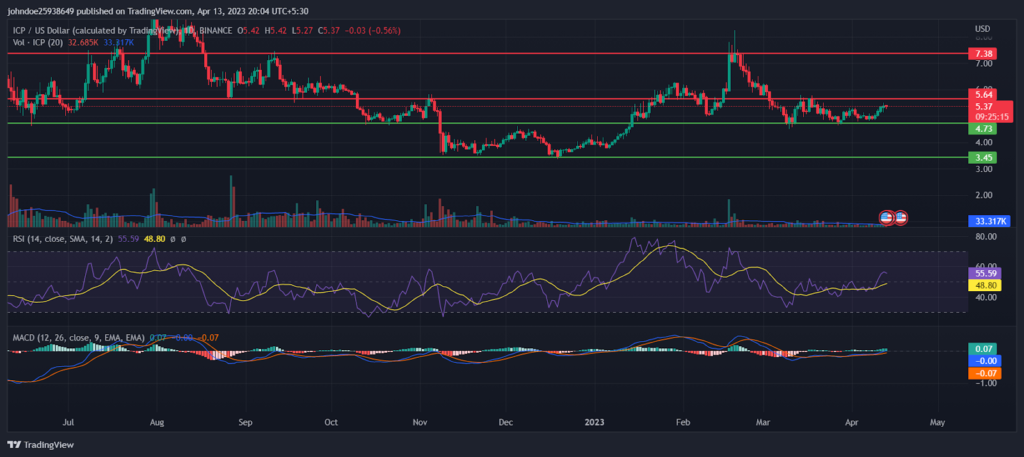
Technical indicators show the relative strength index in the overbought zone and is heading toward the overbought zone. The current RSI of 55.59 is above the average RSI of 48.80. The price is below the 20-day EMA and is lagging behind 50,100,200 days of DMA. The MACD and MACD signal have intersected giving a positive crossover.
Conclusion
The current market trend for Internet Computer (ICP) suggests a shift towards bullish momentum, but the bears are still present, causing fluctuations in the coin’s price. Technical indicators show that the relative strength index is in the overbought zone, and the price is lagging behind its DMA levels. The trading volume has decreased, suggesting an increase in selling pressure, making it difficult for bulls to manipulate the market.
Technical Levels
Support Levels: $4.73 and $3.45
Resistance Levels: $5.64 and $7.38
Disclaimer
The views and opinions stated by the author, or any people named in this article, are for informational ideas only. They do not establish financial, investment, or other advice. Investing in or trading crypto assets comes with a risk of financial loss.
Steve Anderson is an Australian crypto enthusiast. He is a specialist in management and trading for over 5 years. Steve has worked as a crypto trader, he loves learning about decentralisation, understanding the true potential of the blockchain.


