
 Home
Home News
News
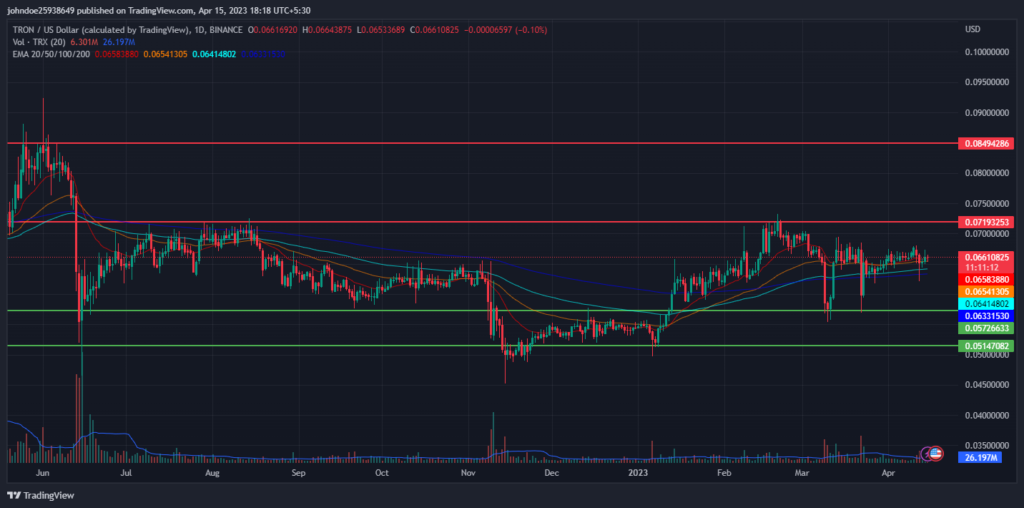
- The TRON was at $0.06604, decreasing 1.12% during the intraday trading session, and between the primary support and resistance is consolidating.
- The 24-hour low of TRX was $0.06563 and the 24-hour high of TRX was $0.06681.
- The TRON token price is above 20, 50, 100, and 200-Day EMA.
The pair of TRX/BTC was trading at 0.00000217 BTC with a rise of 0.10% over the intraday trading session. The token, however, experienced a rise of 10.20% in the previous trading year under a bull market. Due to strong selling pressure in the market, the TRX token fell to its secondary support level of $0.0514 at the end of 2022.
However, after the start of 2023, the TRX token began its upward movement with the help of the accumulated buyers breaking its primary support of $0.057. This indicates that the buyers were in total control of the market since the start of 2023. But as soon as the token price tested its primary resistance of $0.0719 it got rejected and sellers became active again in the market. This indicates the increase in short positions in the market. Since then the token price is consolidating between its 100-Day DMA and its primary resistance. This shows that the 100-Day DMA is acting as the primary support for the TRX token price over the daily time frame chart.
TRON price prediction suggests that if buyers push themselves then the token price may break out from its consolidation phase and can show a rally over the daily time frame chart. But if sellers took over the market then bears may pull down the token price to its primary support.
The trading volume of the token decreased by 34.40% in the last 24 hours, indicating a relationship between the trading volume and the price of TRX, showing an increase in bearish intent.
TRON technical analysis:
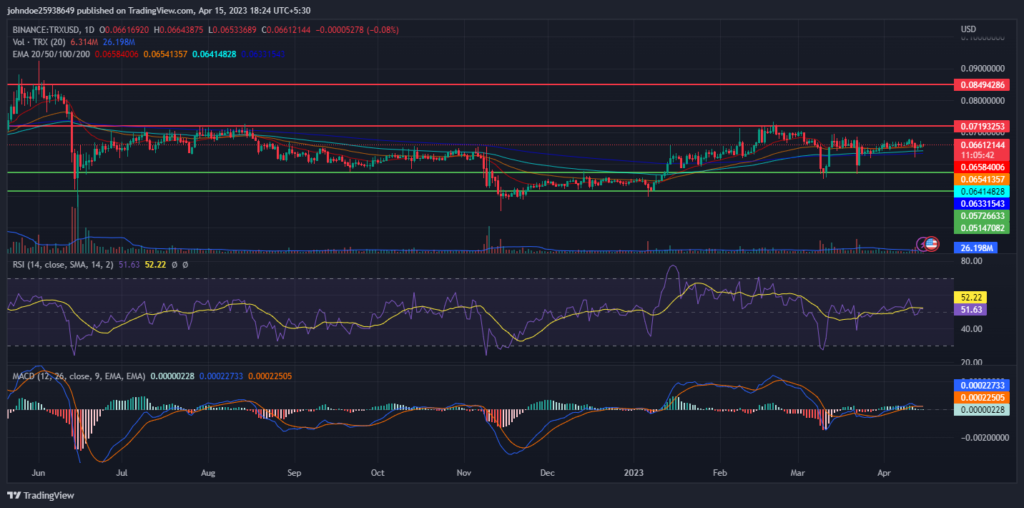
The Relative Strength Index (RSI) is decreasing in the overbought zone and has shown a negative crossover. This suggests the sellers are in the majority of the market and pushing TRX upwards. The current value of RSI is 50.36, which is below the average RSI value of $51.46.
MACD and the signal line are intersecting but does not show any definitive crossover over the daily chart which can support the RSI claims. However, the MACD and the signal line are above zero which indicates bullish intent.
Conclusion
TRON price prediction suggests that if buyers push themselves then the token price may break out from its consolidation phase. The sudden decrease in trading volume shows negative market sentiment toward the TRX token.
Furthermore, RSI is decreasing and has shown a negative crossover over the daily trading chart which indicates weakness in the bullish intent. However, MACD and the signal line are above zero which contradicts the RSI. Traders should wait for any significant move over the daily chart before entering the market.
Technical Levels-
Resistance level- $0.0719 and $0.0849
Support level- $0.0572 and $0.0514
Disclaimer-
The views and opinions stated by the author, or any people named in this article, are for informational purposes only, and they do not establish financial, investment, or other advice. Investing in or trading crypto assets comes with a risk of financial loss.

Andrew is a blockchain developer who developed his interest in cryptocurrencies while pursuing his post-graduation major in blockchain development. He is a keen observer of details and shares his passion for writing, along with coding. His backend knowledge about blockchain helps him give a unique perspective to his writing skills, and a reliable craft at explaining the concepts such as blockchain programming, languages and token minting. He also frequently shares technical details and performance indicators of ICOs and IDOs.


