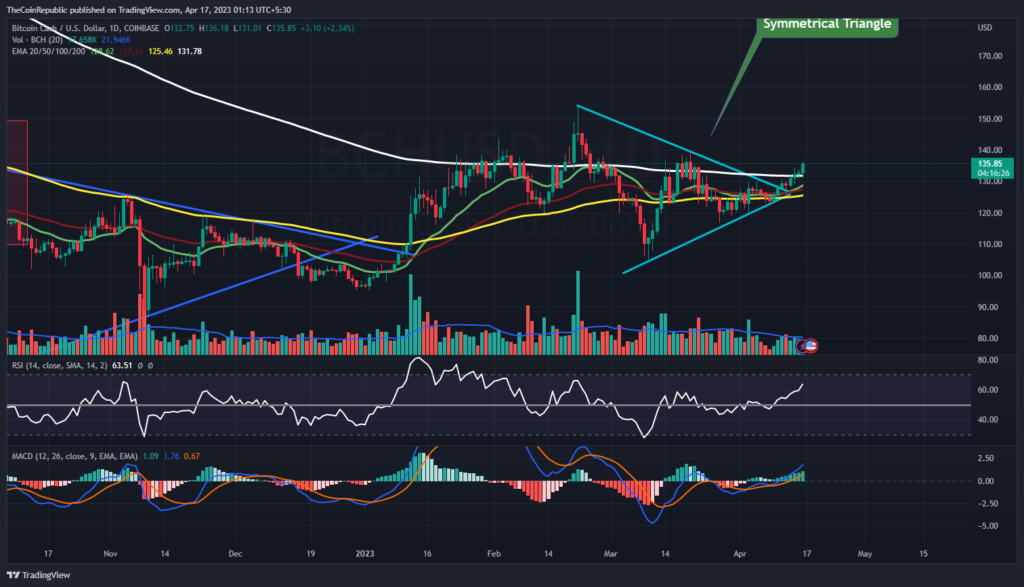
- According to Bitcoin Cash Price Prediction, BCH currency appears ready to break out of an intriguing trend.
- BCH crypto price is trading above 20, 50, 100 and 200-days Daily Moving Average.
- To continue its rebound, the cryptocurrency Bitcoin Cash needs to escape from the upper trendline.
In 2017, Bitcoin Cash was produced as a result of a hard fork in the original Bitcoin blockchain. It has bigger blocks than Bitcoin, making transactions faster and less expensive. The block size of Bitcoin is 1MB, however it is 32MB for Bitcoin Cash.
Processing more transactions allows for faster confirmation times because to the larger blockchain.It facilitates the widespread use of BCH by businesses. Although Bitcoin Cash now provides a low return on investment, this could change in the future. The largest cryptocurrency is Bitcoin Cash, which has a blockchain size of 187,842,367kb and an inflation rate of $150,000,000,000 based on daily BCH mining.
92% of its supply, which is identical to Bitcoin’s, is now in use. BCH has risen more than 65% since its all-time low and fallen 97% from its all-time high. The average transaction value for BCH is $440,000, and over the past several weeks, this value has been declining.
The 28th most valued cryptocurrency is Bitcoin Cash, with a market worth of $2.4 billion. The asset price volume has declined by 0.38% during the intraday session. The volume-to-market cap ratio for BCH indicates a steady upward price trend.
Bitcoin Cash Price Prediction: Technical Indications!

The forecast for Bitcoin Cash’s price points to the cryptocurrency’s recovery phase during the day’s trade. The BCH cryptocurrency must break out of the symmetrical triangle pattern it has been trading in. Buyers are attempting to push the BCH cryptocurrency price over the symmetrical triangle pattern’s top trendline, though.
BCH cryptocurrency has risen by about 9.69% in the past week and 7.77% over the past month. Additionally, Bitcoin Cash has recovered about 8.73% in the last three months, and BCH Crypto has gained 40% so far this year, indicating that its recovery will be at its strongest in 2023.
Technical signs point to the BCH cryptocurrency’s increasing trend. The overbought region of the relative strength index shows the BCH cryptocurrency price’s rising momentum. The RSI was at 63 and was attempting to maintain itself towards the overbought region.
The price of Bitcoin Cash is on an upward trend, as seen by MACD. After a positive crossing, the MACD line is higher than the signal line. Until the bull maintains momentum at the higher trendline, BCH investors must wait.
Summary
In 2017, Bitcoin Cash was produced as a result of a hard fork in the original Bitcoin blockchain. The forecast for Bitcoin Cash’s price points to the cryptocurrency’s recovery phase during the day’s trade. Technical signs point to the BCH cryptocurrency’s increasing trend. The overbought region of the relative strength index shows the BCH cryptocurrency price’s rising momentum. Until the bull maintains momentum at the higher trendline, BCH investors must wait.
Technical Levels
Support Levels: $130 and $127.50
Resistance Levels: $140 and $150
Disclaimer
The views and opinions stated by the author, or any people named in this article, are for informational purposes only, and they do not establish financial, investment, or other advice. Investing in or trading crypto assets comes with a risk of financial loss.

Nancy J. Allen is a crypto enthusiast, with a major in macroeconomics and minor in business statistics. She believes that cryptocurrencies inspire people to be their own banks, and step aside from traditional monetary exchange systems. She is also intrigued by blockchain technology and its functioning. She frequently researches, and posts content on the top altcoins, their theoretical working principles and technical price predictions.


 Home
Home News
News


