
 Home
Home News
News

- Ethereum is likely to test the support near $1860.
- The ETH price marked a drop of more than 8% intraday.
Ethereum price marked a major drop after the long-awaited Shapella upgrade. Last week’s Ethereum Shapella hard fork was a major milestone for the network. Several more upgrades are slated for later this year and in the coming years. ETH price struggled to climb further above the $2,125 resistance zone and marked a decline of more than 8% intraday.
The drop in ETH price has started to correct immediately, taking leverage of the upcoming upgrades and the new launch by a major French banking and financial services firm, Societe Generale. Societe Generale announced plans to launch an Ethereum-based stablecoin which will be pegged to the euro. The stablecoin is meant to target institutional clients.

The Pictorial
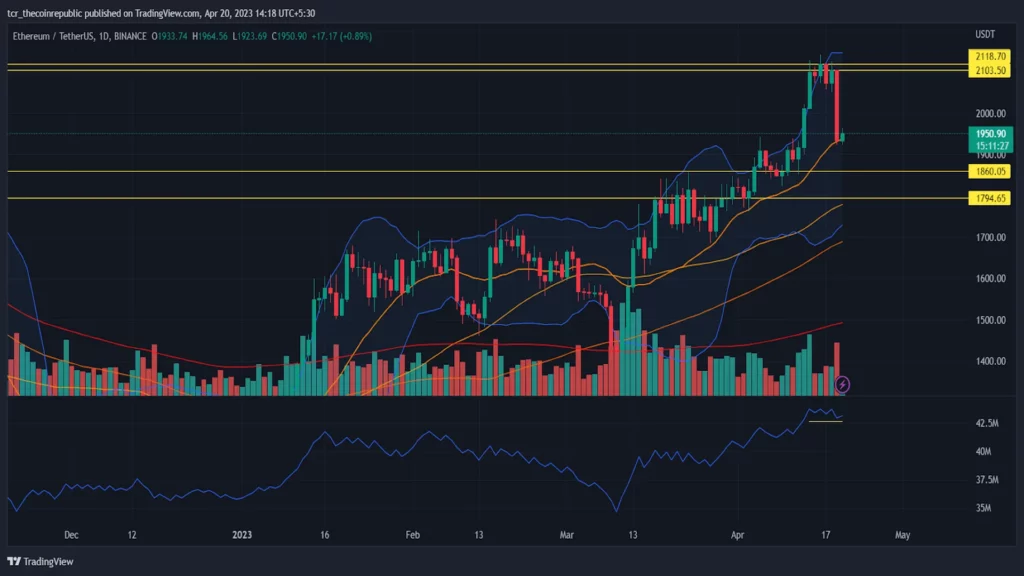
Source: ETH/USDT by TradingView
The ETH price dropped by more than 8% in a single trading session. The volume displayed massive sell-offs. The diverging Bollinger Bands indicate the volatility in the Ethereum price. The current fall reclaimed the 20-EMA, taking support at which ETH price started to correct the drop. The OBV marks a sideways movement suggesting ambiguity in the market.
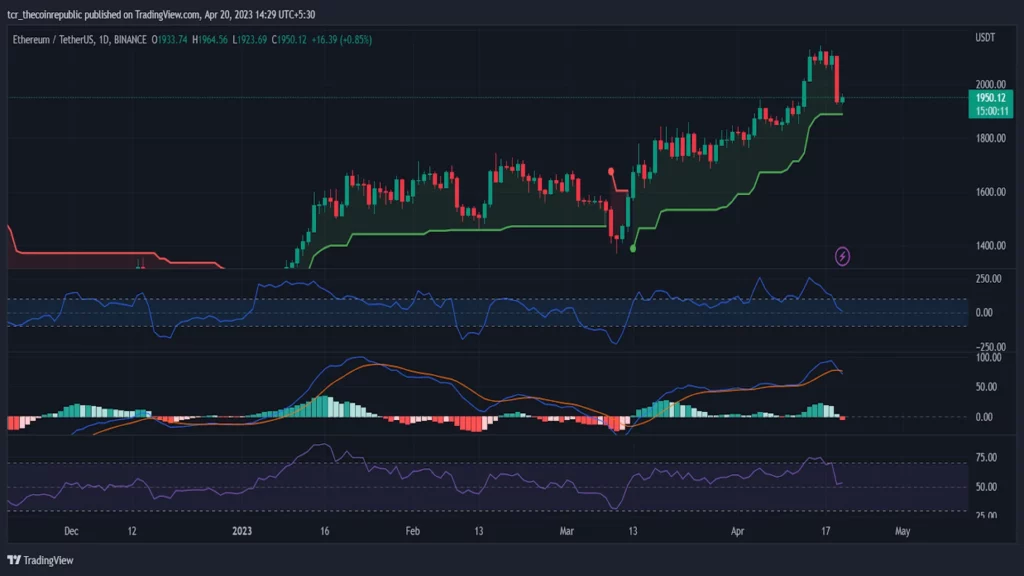
Source: ETH/USDT by TradingView
ETH price forms a rising step-like bullish pattern in Super Trends, and the current trend shows a horizontal movement. The CCI dropped to the zero mark reflecting the contracting difference between the present ETH price and historical prices. The MACD undergoes a bearish divergence and records a tall buyer bar below the zero-histogram mark in the region. The RSI falls and goes flat near the 50-range, indicating a decline in buyer interest.
The Peephole
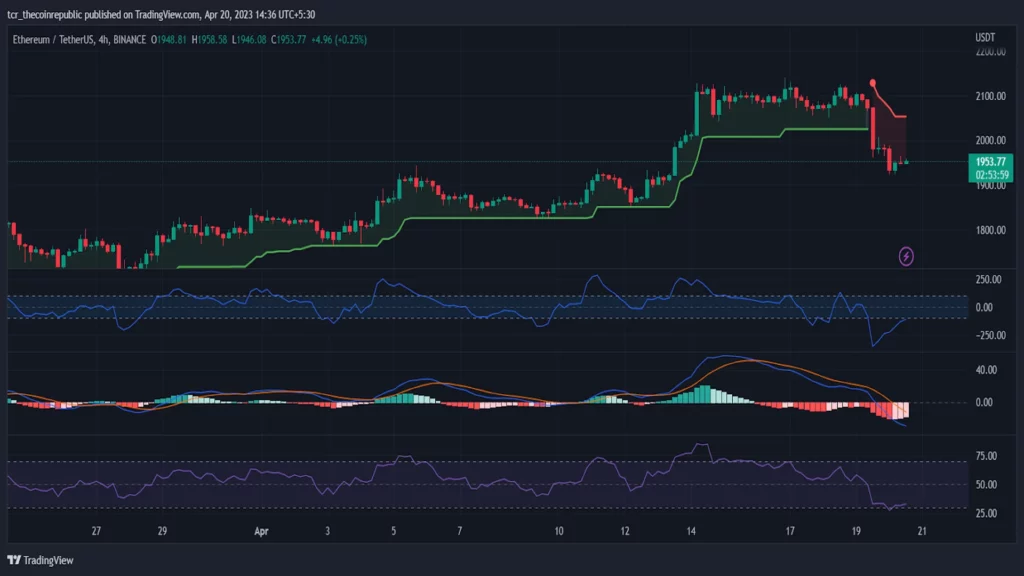
Source: ETH/USDT by TradingView
Ethereum price shows a sharp fall in the more petite time frame. The Super Trends form a downtrend for falling ETH prices and signal the beginning of bearish momentum. The CCI retraced to negative 100 from the lower ranges, suggesting a narrowing gap between current prices and historical prices. The MACD widens the negative gap and records tall seller bars. The RSI moves parallel to the ceiling range suggesting a stagnant seller influence.
Conclusion
The Ethereum price drop caused a panic sell-off in the market and breached the prevailing bullish trend. Prices took support at 20-EMA and tried to correct the decline. The $1860.05 acts as solid support for the present downtrend. ETH price could rise, taking leverage from the upcoming upgrades in the network.
Technical levels
Support levels: $1860.05 and $1794.65
Resistance levels: $2103.50 and $2118.70
Disclaimer
The views and opinions stated by the author, or any people named in this article, are for informational purposes only and do not establish financial, investment, or other advice. Investing in or trading crypto assets comes with a risk of financial loss.

Andrew is a blockchain developer who developed his interest in cryptocurrencies while pursuing his post-graduation major in blockchain development. He is a keen observer of details and shares his passion for writing, along with coding. His backend knowledge about blockchain helps him give a unique perspective to his writing skills, and a reliable craft at explaining the concepts such as blockchain programming, languages and token minting. He also frequently shares technical details and performance indicators of ICOs and IDOs.


