
 Home
Home News
News
- DOT price is currently trading at $6.370 while seeing a change of -16% in 24-hour trading volume.
- The price of DOT is observing a decline of 2.02% in the last 24 hours.
The investors’ sentiments regarding the DOT price are taking a bullish turn. At present, the price of DOT is moving on an uptrend. It recently saw a sudden 54% surge in price near early January. After making a small correction, it made another attempt to continue the uptrend making another rally of 34%, trading under a widening wedge pattern. However, despite the bullish sentiments, the price could not cross its major resistance levels above 200 EMA.
DOT price taking resistance from the 200 EMA
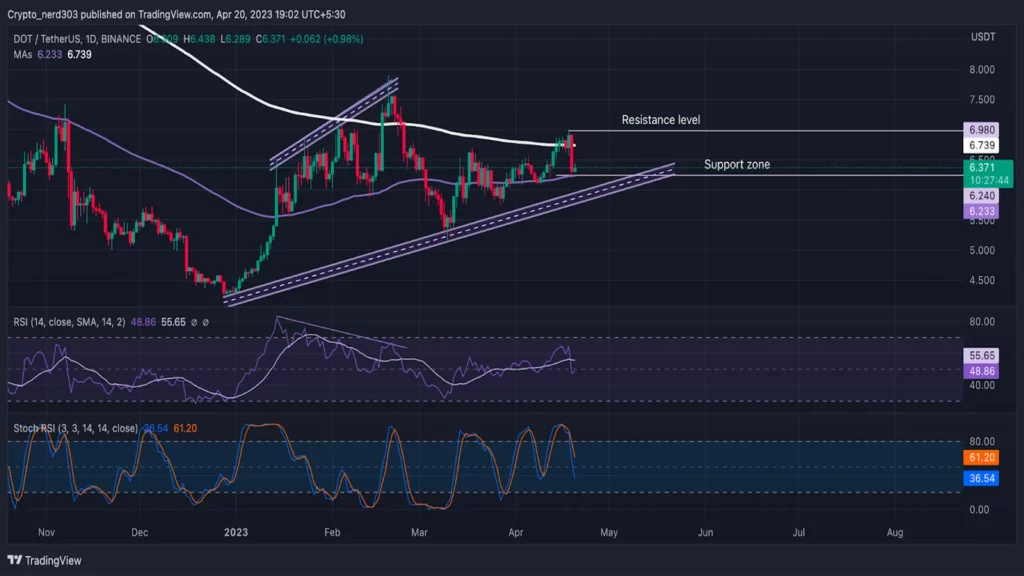
Source: DOT/USDT by TradingView

After trading on a bull trend near mid-January, the price started trading under a wedge channel, making higher high-lower-low patterns. And the RSI line started taking divergence from the price. As the widening wedge and RSI divergence gave bearish indications, the price sharply fell 30% after taking resistance from 200 EMA.
The price of DOT is moving in the contrast between the Moving Averages and the Exponential Moving Averages. Where on the one hand, the Moving Average is giving bullish indication by providing support to the price the Exponential Moving Average provides resistance to it.
The DOT price currently trades between the 100 and 200 EMA, respectively. The current support levels for the DOT price are around $6.240, and its major support level is at $5.500. The resistance point for the price of DOT is nearly $7.000, and its major resistance is $8.000.
The RSI has recently crossed below the median line and 14 SMA. The RSI suggests it might take a bullish correction on the daily timeframe. The value of the RSI line as of now is 48.86 points, while the 14 SMA is providing support at 55.65 points.
The stochastic RSI is taking a bearish reversal. The stochastic RSI provides more direct signals than RSI at present, it is taking a sharp turn towards the oversold levels. The %K line has also crossed below the %D line.
Conclusion
According to analysis, the DOT price is trading between the 100 and 200 EMA, where the Moving averages have already given a bullish crossover. If the price breaks above the major EMA’s on the daily timeframe, it will strengthen the bull’s presence in price.
The oscillators indicate that the price may make a short-term bearish trend shortly on a daily basis.
Technical levels –
Support – $6.240 and $5.500
Resistance – $0.8000 and $0.7000
Disclaimer
The views and opinions stated by the author, or any people named in this article, are for informational purposes only and do not establish financial, investment, or other advice. Investing in or trading crypto assets comes with a risk of financial loss.

Andrew is a blockchain developer who developed his interest in cryptocurrencies while pursuing his post-graduation major in blockchain development. He is a keen observer of details and shares his passion for writing, along with coding. His backend knowledge about blockchain helps him give a unique perspective to his writing skills, and a reliable craft at explaining the concepts such as blockchain programming, languages and token minting. He also frequently shares technical details and performance indicators of ICOs and IDOs.


