
 Home
Home News
News
- KLAY price is currently trading at $0.224 with a change in 24-hour trading volume of -1.39 percent.
- KLAY price has been observing an increase of 4.30% in the last 24 hours.
The investor’s sentiments regarding KLAY are taking a bullish turn after gaining the support of the buyers from the middle of October. Bullish enthusiasm caused the price to rise by more than 95%. Though the severe resistance of 200 EMA did not yield and the sellers overwhelmed the KLAY after which the price saw a fall of more than 56%.
The price made another attempt to make a breakout near mid-February. Followed by a narrow convergence between 20,50 and 100 EMA’s the KLAY price made a second attempt to make the breakout and this time it was successful in crossing above the 200 EMA. The price gained 95% of its value back in this endeavor however after making a retest the buyers refused to support the price and it broke the support level with strength.
KLAY price trading above the 100 EMA on the (Daily Timeframe)
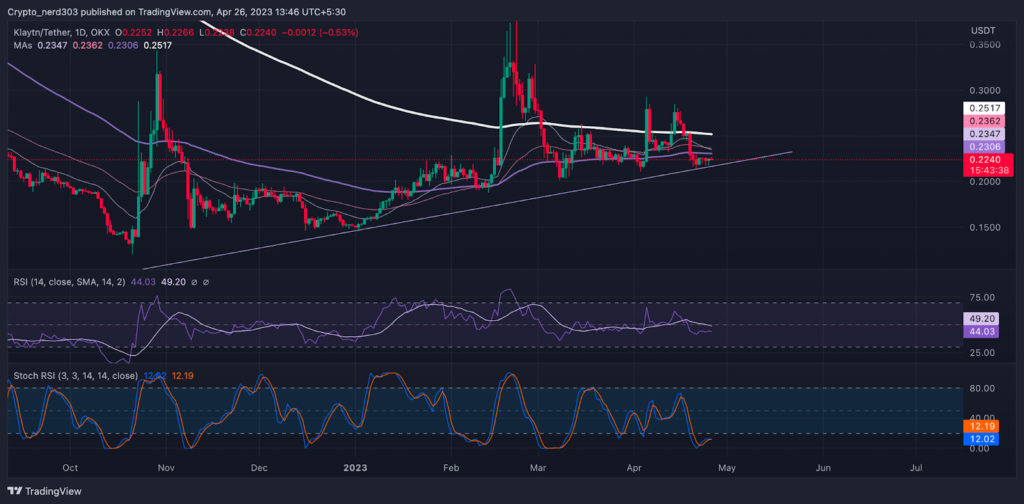
In a previous analysis near early April, the price started trading 100 EMA within a consolidation with the convergence between 20,50,100 EMA. It was suggested by analysts that if the price makes a breakout it can make a bullish recovery. After taking a reversal from the demand zone the price made a rally of 38% though it could not retain its previous target of 70%.
Technical Analysis ( 1 Day Timeframe )
Source: KLAY/USDT by TradingView
The RSI line is making a bullish curve below the median line. The value of the RSI line as of now is 45.60 points, while the 14 SMA is providing support at 49.31 points. If the RSI line crosses above the median line and 14 SMA it may suggest a bullish breakout.
The stochastic RSI is taking a reversal from the demand zone with a bullish interception between the %K and %D lines. The present value of 14.51 points and it may soon give a crossover of the 30 points.
Conclusion
At present, the faster-moving average 20/50/100 EMA’s are making a convergence near the demand zone. Making a similar convergence near mid-February the price made a bullish rally of more than 95%. The price has been giving bullish movements after a brief consolidation period.
A similar breakout can be expected in the near future. Although it is currently facing strong resistance from the 200 EMA therefore the price will need strong buyers’ support to continue its bullish trend.
Technical levels –
Support -$0.2000 and $0.2100
Resistance – $0.350 and $0.3000
Disclaimer
The views and opinions stated by the author, or any people named in this article, are for informational purposes only, and they do not establish financial, investment, or other advice. Investing in or trading crypto assets comes with a risk of financial loss.

Andrew is a blockchain developer who developed his interest in cryptocurrencies while pursuing his post-graduation major in blockchain development. He is a keen observer of details and shares his passion for writing, along with coding. His backend knowledge about blockchain helps him give a unique perspective to his writing skills, and a reliable craft at explaining the concepts such as blockchain programming, languages and token minting. He also frequently shares technical details and performance indicators of ICOs and IDOs.


