
 Home
Home News
News

- XLM price prediction remains bullish till it sustains above $0.0750 support.
- XLM Price dropped below the 200 day EMA but lacked downside momentum.
- XLM price witnessed profit booking from the supply zone.
XLM price prediction is bullish for the long term till it sustains $0.0750 support level. XLM price showed a decent recovery in the previous month and breakout of $0.1000 hurdle with a higher volume. It triggered the positive sentiment and prices rallied 20% approx in the short span of time. However, the rally halted at $0.1147 and prices witnessed profit booking. Therefore, $0.1147 will act as an immediate hurdle in the coming months.

Stellar price drops below the 50 and 200 day EMA indicates downtrend. But the EMA is sloping sideways, denoting prices are likely to consolidate for some more time before deciding the further direction.

XLM price is trading at $0.0955 with an intraday decline of -0.31%. The 24 hour volume to market cap ratio is 0.0112. The pair of XLM/BTC is trading at 0.00000325 with an intraday decline of -0.61%.
At the mid of March, XLM price took support near the yearly lows and formed a bullish hammer candle. Later, prices managed to climb above the 50 day EMA which showed the initial signs of bullish trend reversal. It breakout of the higher range of consolidation which created positive hope for continuing the upward momentum.
Is the breakout in XLM price sustainable?
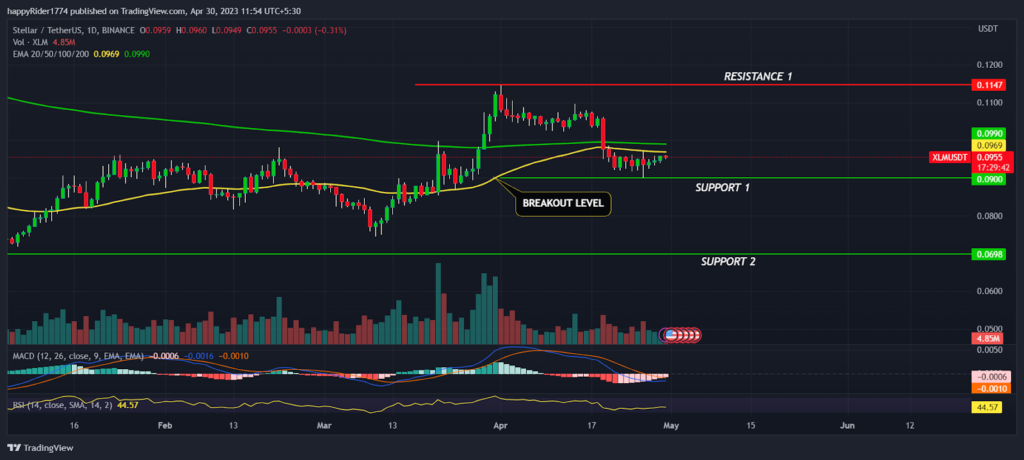
XLM price hits a swing high at $0.1147 and begins to consolidate in the supply zone. Recently, in the previous week the XLM price dropped below the lower range and retraced down to breakout level.
Presently, XLM price is trying to defend the $0.0900 support to maintain the confidence of the bullish traders. However, if the price slipped below the $0.0900 support then the breakout will be interpreted as a bull trap. Bears will try to drag the prices towards yearly lows and it will also erode the returns generated in previous months. On the other hand, if buyers succeed to trade above both the EMAs then possibility of the upward momentum will increase. The technical analysis suggests XLM crypto breakout looks sustainable and prices are likely to recover in coming months.
Will XLM price correlate with overall market direction?
XLM price forming a bullish hammer candle on a weekly time frame indicates responsive buyers active on lower levels. The overall market sentiment is also bullish which may positively impact the direction of the XLM crypto. The technical indicators like MACD had generated negative crossover but the curve is reversing upward. It indicates prices might take reversal from the lower levels. The RSI 44 sloping sideways denotes price is trying to reach the neutral territory.
Conclusion
XLM price prediction remains bullish and suggests a rise in the long term till it sustains above the support. XLM price trying to defend the previous breakout level to maintain the confidence of bullish traders. The technical analysis suggests, XLM crypto breakout looks sustainable and prices are likely to correlate with overall market direction and rebound.
Technical levels
Resistance levels : $0.1147 and $0.1300
Support levels : $0.0900 and $0.0698
Disclaimer
The views and opinions stated by the author, or any people named in this article, are for informational purposes only. They do not establish financial, investment, or other advice. Investing in or trading crypto assets comes with a risk of financial loss.

Nancy J. Allen is a crypto enthusiast, with a major in macroeconomics and minor in business statistics. She believes that cryptocurrencies inspire people to be their own banks, and step aside from traditional monetary exchange systems. She is also intrigued by blockchain technology and its functioning. She frequently researches, and posts content on the top altcoins, their theoretical working principles and technical price predictions.


