
 Home
Home News
News

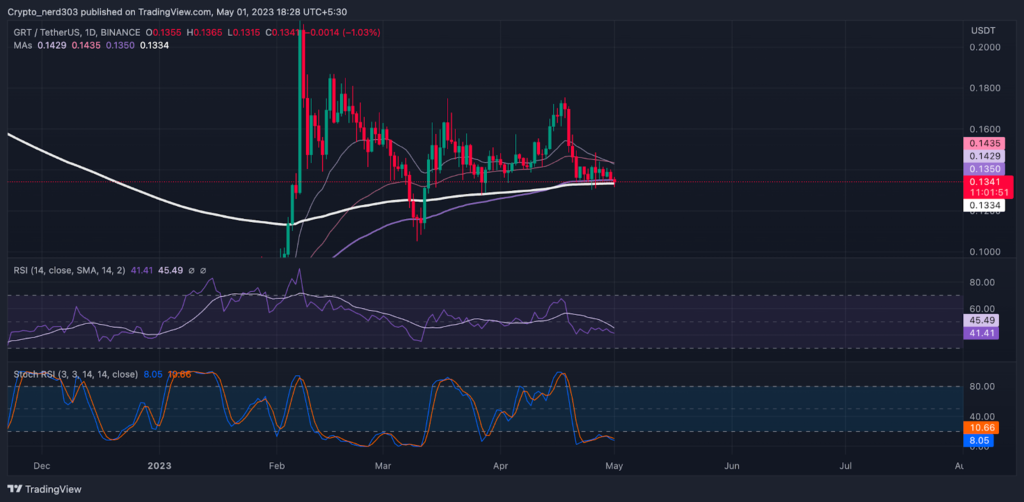
- The GRT price is currently trading at $0.1341 while seeing a change of 33% in the 24-hour trading volume.
- The GRT price is observing a decline of 2.16% in the last 24 hours.
The GRT price is giving bullish indications at present. The price is predicted to see an increase of 31% within the next week if it gains buyers’ support. Currently, it is trading within a consolidation channel in the daily timeframe. Investors’ sentiments regarding the price are currently indecisive. The consolidation suggests that the price is currently in the accumulation phase. The buyers and sellers are struggling for the command of the market.

The technical Indicators are backing up the bulls. Presently the price is gaining support from the 100 and 200 EMA near $0.1300 and it is also trading above the 200 Moving average. The Ocilators RSI and Stochestic RSI are trading near the demand zone.

The GRT price facing resistance from the 50 EMA (Daily Timeframe)

In the previous analysis of the GRT price near early April, it was predicted that If the price gets buyers’ support from the current levels, it can attain a target of 35% near the $0.1800 price. This prediction was given because at that time the price was getting strong support from the 200 and 100 EMA similar to the current situation.
The price of Graph was consolidating above the 200 EMA also making a bullish Doji candle, which is a reversal candlestick pattern. The prediction was proven correct when after taking a reversal the price made an exact rally of 35% within 3 weeks.
Technical Analysis ( 1 Day Timeframe )
After making the bullish rally the price took a reversal of 23% within a week, considerably faster than the time it took in making the rally.
The RSI line is at present taking resistance from the 14 SMA below the median line. At present, the RSI line is trading at 41.41 points, whereas the 14 SMA is trending just below the 50 RSI point at around 45.49 points.
Presently, the stochastic RSI is trading around extreme oversold levels. The %K line is indicating a bullish interception to the %D line in the near future. At present the value of Stochestic RSI is 8.05 points.
Conclusion
According to the analysis, If the price is supported by the investors it can make an uptrend of 31% within the next few weeks reaching its target near $0.1800 and its nearest support zone is at the $0.1300 level. The majority of the technical indicators are giving indications of a bullish reversal for price in the near future.
Technical Levels:
Support –$0.1300
Resistance – $0.1800
Disclaimer
The views and opinions stated by the author, or any people named in this article, are for informational purposes only, and they do not establish financial, investment, or other advice. Investing in or trading crypto assets comes with a risk of financial loss.

Nancy J. Allen is a crypto enthusiast, with a major in macroeconomics and minor in business statistics. She believes that cryptocurrencies inspire people to be their own banks, and step aside from traditional monetary exchange systems. She is also intrigued by blockchain technology and its functioning. She frequently researches, and posts content on the top altcoins, their theoretical working principles and technical price predictions.


