
 Home
Home News
News
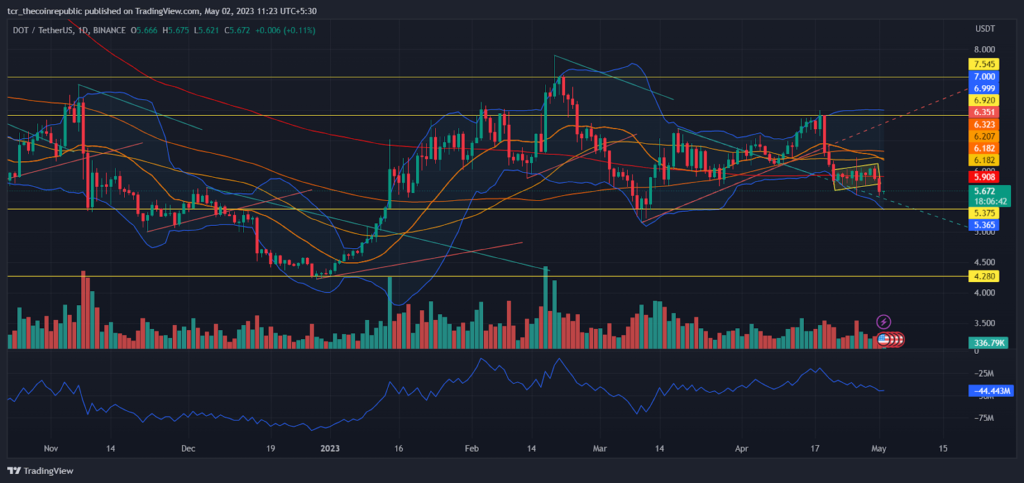
Polkadot price analysis discloses a possible nosedive in the future price movement, taking into account the present momentum. The trend has been bearish as the prices are taking a downturn for the past several days. The uptrend was abruptly switched to bearish trend when prices faced rejection at $6.920. This downward oscillation caused a substantial deficit in the DOT price levels to descend to a price of $5.67 at press time. After several attempts, DOT price could not change the course of movement and may test the support near $5.375.
The Picturesque
In the daily time frame, DOT price has a robust negative momentum, with prices falling. The trend is currently favoring bears, demonstrating a successfully established dominance in the market. The dropping price is forming a trend line that slopes downwards. Due to the decline, falling DOT price is seeking to test the support near $5.375. The Bollinger Bands indicate a rising volatility with both bands enlarging. The EMA ribbon floats above the current price action indicating a bearish momentum. A dipping OBV suggests an unfavorable market for Polkadot.
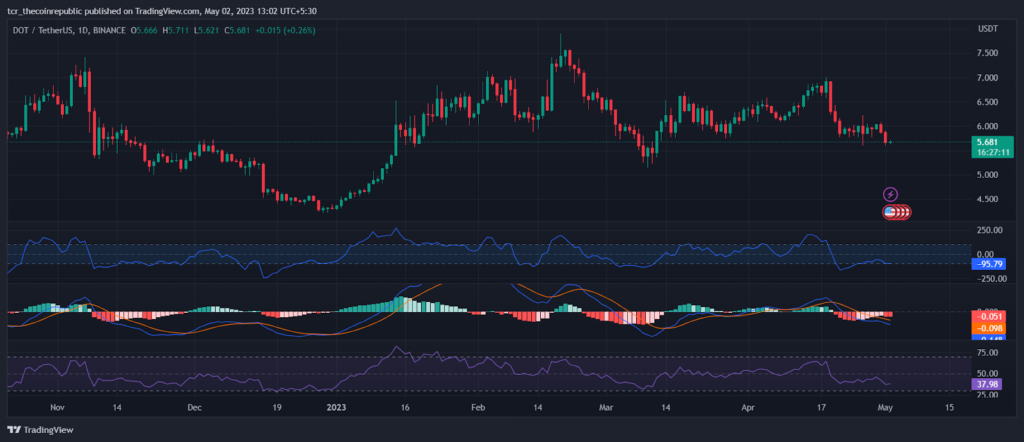
DOT price is moving under bearish influence as the trend gains pace. The CCI marks a negative difference between historical prices and the present price of DOT. The MACD forms a negative cross and records sellers participating in the market. The RSI has decreased to 40-range in the lower part of the neutral zone, due to the downward trending line.
The Peephole
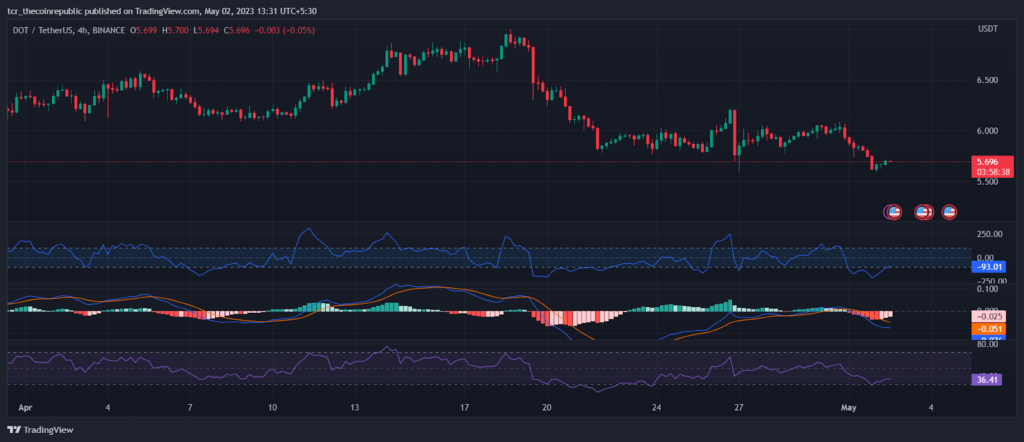
In the smaller time frame, the bulls are currently attempting to lift the DOT price. Despite selling pressure and lower swings forming in the market, DOT forms green candlestick, indicating favorable signs. The CCI has steadily escalated near negative 100-range to mark contracting gap between historical prices and DOT price at press time. The MACD moves to converge in the future and records descending seller bars. The RSI declines due to the downward trend, but it curves slightly upwards reflecting sluggish market buying activity.
Conclusion
DOT price analysis reveals further price decline amid persistent bearishness. The ongoing decline has significantly harmed the market for Polkadot. The $5.375 support can be tested once more in the ensuing hours. If the bulls are unable to hold the momentum, then the price may further plummet down.
Technical levels
Support levels: $5.375 and $4.280
Resistance levels: $6.920 and $7.545
Disclaimer
The views and opinions stated by the author, or any people named in this article, are for informational purposes only and do not establish financial, investment, or other advice. Investing in or trading crypto assets comes with a risk of financial loss.

Andrew is a blockchain developer who developed his interest in cryptocurrencies while pursuing his post-graduation major in blockchain development. He is a keen observer of details and shares his passion for writing, along with coding. His backend knowledge about blockchain helps him give a unique perspective to his writing skills, and a reliable craft at explaining the concepts such as blockchain programming, languages and token minting. He also frequently shares technical details and performance indicators of ICOs and IDOs.


