
 Home
Home News
News
- 1 The RNDR price fell by more than 12% in the past 24 hours.
- 2 The BTC valuation drops by 10.72% intraday.
- 3 Render Token falls to correct the previous rise.
Render Token falls to fix the recent upsurge in RNDR price which occurred and marked a rise of more than 47%. The present correction can attempt to establish a strong bearish trend. The analysts predicted the halt near the primary support level to mark the change in price trend. Although the long-term bets were placed for RNDR price to mark a new all-time high in the recent bullish momentum, the correction came in early.
The Monoscope
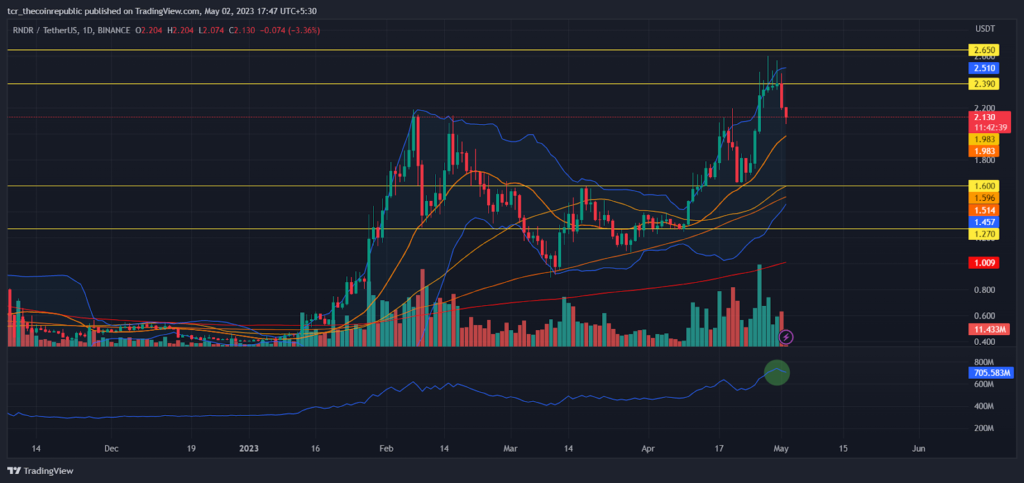
RNDR price marks a corrective movement after the high swing reaching till $2.390. The trading volume which displayed ascending buyer interest, abruptly changed to seller dominant. The EMA ribbon floats under the current price action to denote the recent bulls but can soon be captured by falling prices. The Bollinger bands maintain their width to depict the correction of price volatility. The downtick in OBV suggests a dipping market ahead. The falling prices can look for support near $1.600.
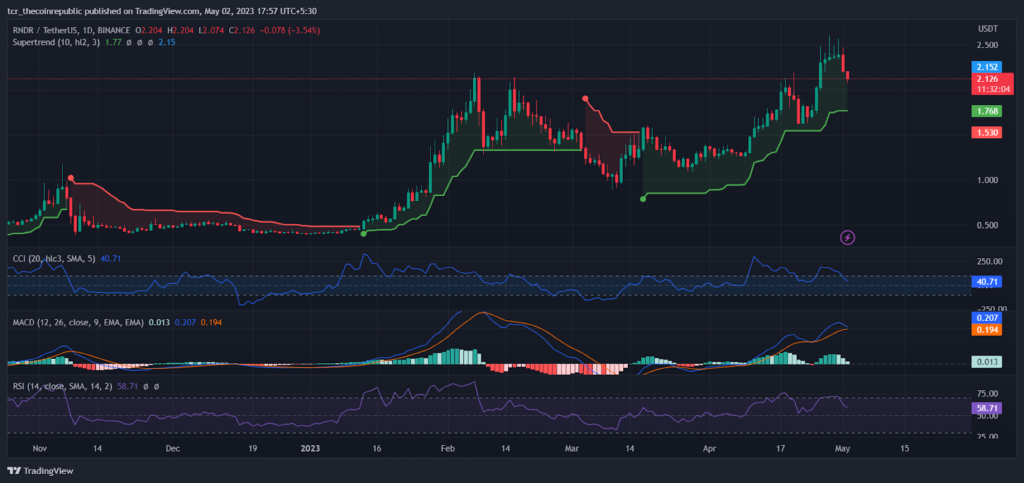
Falling RNDR price can attempt to break the bullish trend formed in Super Trends due to an upsurge. The CCI marks a contracting difference between the historical price and the present price. The MACD nears a convergence and records descending buyer bars in the positive zone. The RSI drops near 60-range from the overbought zone to suggest a decline in buyer interest.
The Microscope
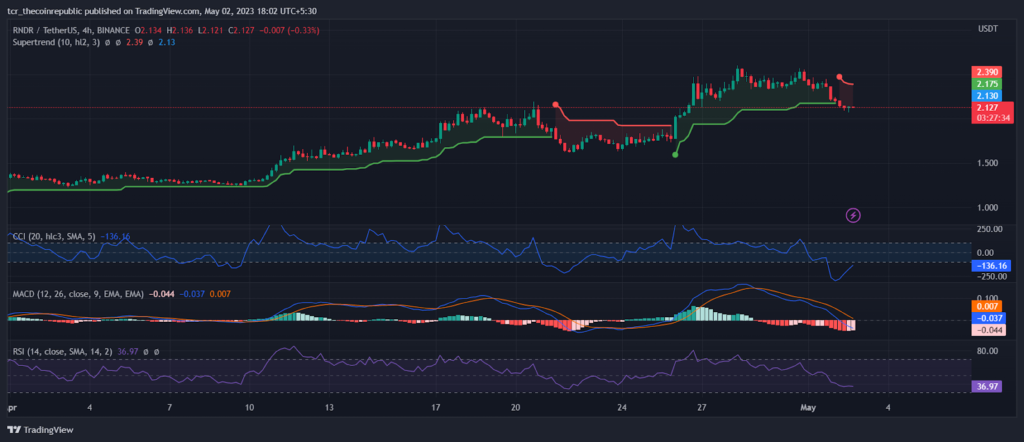
In the four-hour time frame, the RNDR price suggests initiation of bearish momentum in the Super Trends. The CCI marks a retracement in difference between historical prices and RNDR price at press time. The MACD forms a negative crossover and records seller bars in the region below the zero-histogram mark. The RSI falls to 40-range in the region below the half line to mark a decline in buyers and rise in sellers.
Conclusion
Render Token marks a steep correction after the price rally. The bulls fall weak to the market bears that take over to establish a downtrend in prices. The price action can drop further and find support near $1.600 to put a halt to the price freefall. The holders can watch for prices reaching the demand zone.
Technical levels
Support levels: $1.600 and $1.270
Resistance levels: 2.390 and $2.650
Disclaimer
The views and opinions stated by the author, or any people named in this article, are for informational purposes only and do not establish financial, investment, or other advice. Investing in or trading crypto assets comes with a risk of financial loss.

Nancy J. Allen is a crypto enthusiast, with a major in macroeconomics and minor in business statistics. She believes that cryptocurrencies inspire people to be their own banks, and step aside from traditional monetary exchange systems. She is also intrigued by blockchain technology and its functioning. She frequently researches, and posts content on the top altcoins, their theoretical working principles and technical price predictions.


