
 Home
Home News
News
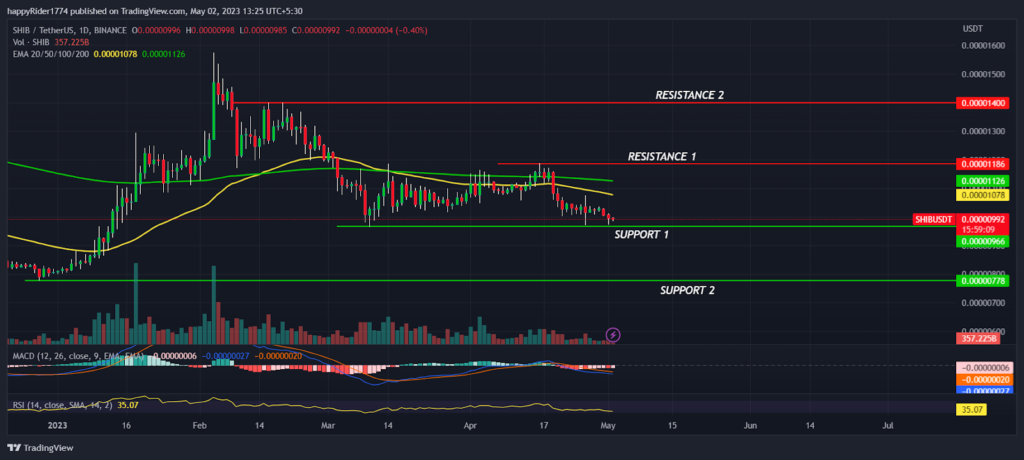
Shiba Inu price corrected 15% approx from the recent swing high and returned back to the lower range. SHIB price seems to be consolidating in the narrow range between $0.00000996 to $0.00001186 and likely to break either side soon.
Shiba Inu coin price rejected the 200 day EMA and also dropped below the 50 day EMA showcase positional trend is in downward direction. However, Till price holds the lower range support the probability of more downside is low.
Shiba Inu price is trading at 0.00000992 with an intraday decline of -0.40%. The 24 hour volume to market cap ratio is at 0.0191. At the beginning of February, SHIB crypto witnessed a massive spike in the buying volume and prices followed the same direction. It attempted to break out of the $0.00001500 hurdle with strong momentum but sadly buyers were unable to hold the higher levels. Later, prices witnessed sharp correction and formed a bearish engulfing candle.
Slow and steady, SHIB price began to decline and eroded the majority portion of the previous gains. The downfall halted near $0.00000996 and tried to recover the losses but buyers again failed and got stuck into narrow range.
Will Shiba Inu price bounce back from swing low?
Shiba Inu price is at a crucial level and responsive buyers are trying to defend the support. If they succeed then we might see bullish trend reversal. However, the confirmation of the trend reversal will come when SHIB price regains the 50 and 200 day EMA.
The overall market sentiment is mildly bullish and market leader Bitcoin is also consolidating in a narrow range. Therefore, if the market sentiment remains bullish then it might positively impact the prices of other Altcoins. The technical analysis suggests, Till SHIB sustains above the demand zone the probability of more downside remains low.
SHIB price: Technical Outlook
SHIB price formed a bearish candle on a weekly time frame and eroded the gains of the past six weeks. As of now, no signs of recovery are visible in the SHIB price. The technical indicators like MACD had generated a negative crossover and histogram bar is on decline. It indicates bearish momentum may continue for some more time.
The RSI at 34 sloping down denotes weakness and strength of the sellers. However, the price near to the oversold territory and short term relief rally may trigger in the coming months.
Conclusion
Shiba Inu price corrected 15% from the swing high and slipped down by forming lower lows swings. SHIB price is stuck into the narrow range and buyers are trying to defend the lower range support. The technical analysis suggests Shiba Inu coin price is near the demand zone and possibility of rebound remains high.
Technical levels
Resistance levels : $0.00001186 and $0.00001400
Support levels : $0.00000900 and $0.00000778
Disclaimer
The views and opinions stated by the author, or any people named in this article, are for informational purposes only. They do not establish financial, investment, or other advice. Investing in or trading crypto assets comes with a risk of financial loss.

With a background in journalism, Ritika Sharma has worked with many reputed media firms focusing on general news such as politics and crime. She joined The Coin Republic as a reporter for crypto, and found a great passion for cryptocurrency, Web3, NFTs and other digital assets. She spends a lot of time researching and delving deeper into these concepts around the clock, and is a strong advocate for women in STEM.


