
 Home
Home News
News
- 1 EGLD’s price is currently trading at $39.21 while recording a 7.95% drop in its 24-hour trading volume.
- 2 EGLD price is recording a fall of 2.15% within the last 24 hours.
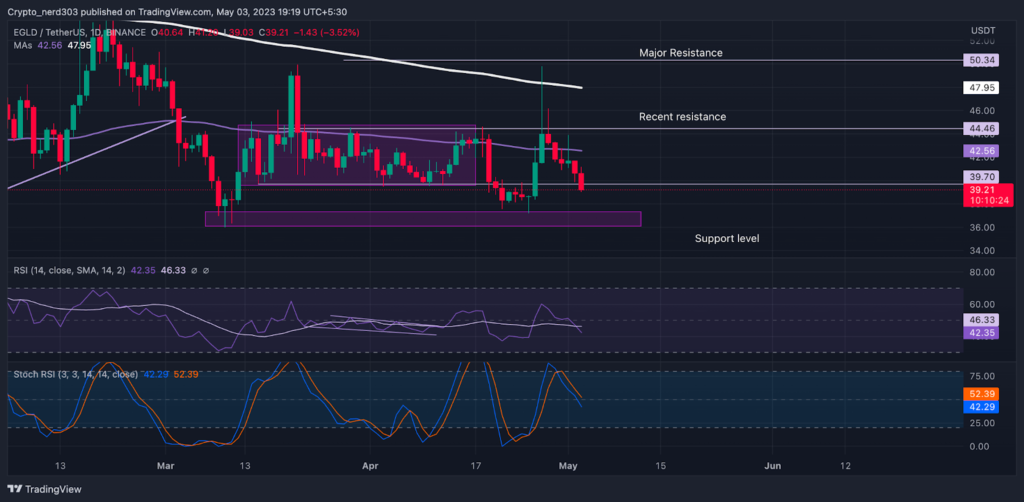
The price of EGLD has been consolidating within a channel for the last few months however recently the EGLD’s price broke its consolidation channel near mid-April with strength. The took a total downfall of 16% after its last attempt to break above the consolidation.
It was estimated that although the consolidation was being made under the 200 EMA and the price is consistently taking resistance from its 100 EMA, The majority of the chances of a breakout were in the bear’s favor.
EGLD Price will have a further bearish decline on the (1-Day Timeframe)
The majority of market sentiments are currently near the greed zone at 64 points, according to the greed and fear index, provided by the Alternative (dot) me platform. There is a increase of 9 points within a short span of time where the sentiments were at 55 points.
The bears are currently overwhelming the price of EGLD tokens across most of the major cryptocurrency exchange platforms by 51 – 60%, according to the Coinglass.
According to the previous analysis that was given by our analysts, it was suggested that the EGLD price can break out of its parallel consolidation channel with a significant bearish move. The price was trading around its major resistance level of around 100 EMA at $44.00. The RSI line was also making a bearish divergence from the price. Therefore, our analysts predicted that the EGLD price may break the consolidation with a bearish move.
This was proven correct: after making a last bullish retest through the 100 EMA the price surrendered to the bears taking an 18% downfall. The reason for this analysis was that the major trend for EGLD price was a downtrend as it was trading below 100 and 200 EMA. On the other hand, the RSI line was making a bearish divergence which was a powerful indicator of a trend reversal.
Technical Analysis (1-Day Timeframe )

The RSI line recently crossed below the median line and 14 SMA on the daily timeframe. The current value of the RSI is 42.35 points whereas the 14 SMA is trading at 46.33 points. The RSI line is steadily moving toward the oversold levels suggesting that the price can follow the same path.
Conclusion
According to our analysts, the price may continue trading in a bearish trend for the next couple of weeks. The price of EGLD is predicted to see a slight further decline before a bullish rally.
Technical levels –
Support -$36.00
Resistance – $40.00 and $50.00
Disclaimer
The views and opinions stated by the author, or any people named in this article, are for informational purposes only, and they do not establish financial, investment, or other advice. Investing in or trading crypto assets comes with a risk of financial loss.
Steve Anderson is an Australian crypto enthusiast. He is a specialist in management and trading for over 5 years. Steve has worked as a crypto trader, he loves learning about decentralisation, understanding the true potential of the blockchain.


