
 Home
Home News
News

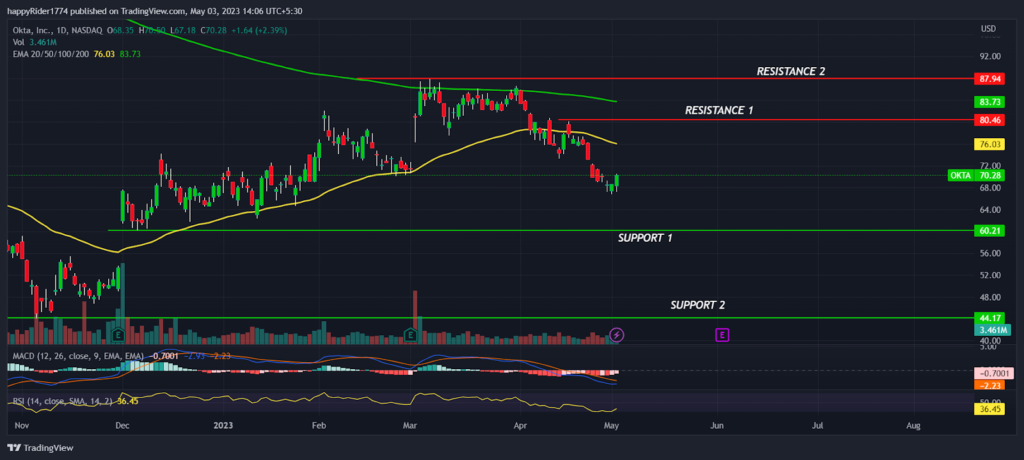
- 1 OKTA stock price fell 20% approx in April month and formed a bearish pattern.
- 2 OKTA stock rejected the 200-day EMA and also dropped below the 50-day EMA.
- 3 OKTA stock price is trading near to the 4 months low.
OKTA stock price fell 20% approx in the previous month and slipped down by forming lower low swings. OKTA stock faced resistance at $87.00 and slowly it dropped below the 50-day EMA. It triggered the negative sentiment and short-term trend has reversed in the downward direction. However, the price is racing toward the demand zone and $60.00 might act as a strong support in coming months.
OKTA stock price closed the previous session at $70.28 with an intraday rise of 2.39%. The market capitalization stands at $11.34 Billion. On March 1, 2023, OKTA Inc (NASDAQ: OKTA) released quarterly earnings. Company beat the EPS estimate by 203% and revenue estimate by 4.11%. Later, stock prices reacted positively and shot up 13% on a single day. It also breaks out of the $80.00 hurdle and hits a new swing high at $87.88.

OKTA stock price consolidated for a few days in the narrow range in the hope of upward range expansion. Sadly prices failed to give the follow-up momentum a reverted in the downward direction. Slowly, it began to decline and eroded the majority portions of the previous gains. The correction is still going on and no signs of recovery is visible.
Will OKTA stock recover or more sell-off possible
OKTA stock price fell 9% approx on previous week and collapsed down with strong momentum. It shows sellers are more active and any short-term pullback will have low probability of sustaining the higher levels.
The overall market sentiment is also turning bearish which might add fuel to the downside momentum. If the sell off continues then bears may try to drag the prices down to $60.00.
On the other hand if the price takes a U-turn then buyers will try to test the 50-day EMA which will act as an immediate hurdle. The technical analysis suggest, OKTA price is in a bear grip and the probability of rebound is low.
OKTA stock: Technical outlook
OKTA stock price formed Doji candle and buyers are trying to defend the $70.00 support. However, the prices have corrected 20% approx from the swing high and may consolidate for some time before deciding the further direction.
Technical indicators like MACD have generated a negative crossover. It indicates bearish momentum may continue for some more time. The RSI at 36 reversing upward from oversold territory and buyers may try to test the neutral zone.
Conclusion
OKTA stock price fell 20% in the previous months and formed a bearish pattern. Till prices are trading below the EMAs any short-term pull back will have low probability of sustaining the higher levels. The technical analysis suggests OKTA stock is in bear grip and possibility of rebound is low.
Technical levels
Resistance levels: $80.00 and $87.00
Support levels: $60.00 and $52.00
Disclaimer
The views and opinions stated by the author, or any people named in this article, are for informational purposes only. They do not establish financial, investment, or other advice. Investing in or trading crypto assets comes with a risk of financial loss.

Andrew is a blockchain developer who developed his interest in cryptocurrencies while pursuing his post-graduation major in blockchain development. He is a keen observer of details and shares his passion for writing, along with coding. His backend knowledge about blockchain helps him give a unique perspective to his writing skills, and a reliable craft at explaining the concepts such as blockchain programming, languages and token minting. He also frequently shares technical details and performance indicators of ICOs and IDOs.


