
 Home
Home News
News

- 1 The Graph price seems to be stuck into the narrow range.
- 2 GRT price displayed a golden crossover and was trying to defend the 200 day EMA.
- 3 Graph crypto price consolidating for the base formation.
The Graph price corrected 28% approx from the recent swing high and returned back to the lower range of consolidation. GRT price has been quite stable in the past few months and is stuck in the narrow range between $0.1056 to $0.1759. If the consolidation continues in coming months then it may be interpreted as a base formation.

The Graph price drops below the 50 day EMA shows the short term trend is reversing in the downward direction. However, the 200 day EMA support is still intact and acting as an immediate support for the bullish traders.

The Graph price is trading at $0.1346 with an intraday decline of -1.25%. The 24 hour volume to market cap ratio is 0.0242. The pair of GRT/BTC is trading at 0.00000462 with an intraday decline of -1.70%. The chart structure of GRT with BTC is in downtrend and sellers seem to be more active as compared to USDT pair.
At the beginning of February, Graph price gained positive momentum and shot up 68% in a single day. It created a hope for the next phase of the rally but unfortunately prices were unable to hold the higher levels. The momentum halted at $0.2324 and prices witnessed profit booking from the higher levels.
Will Graph price take a U-turn or breakdown?
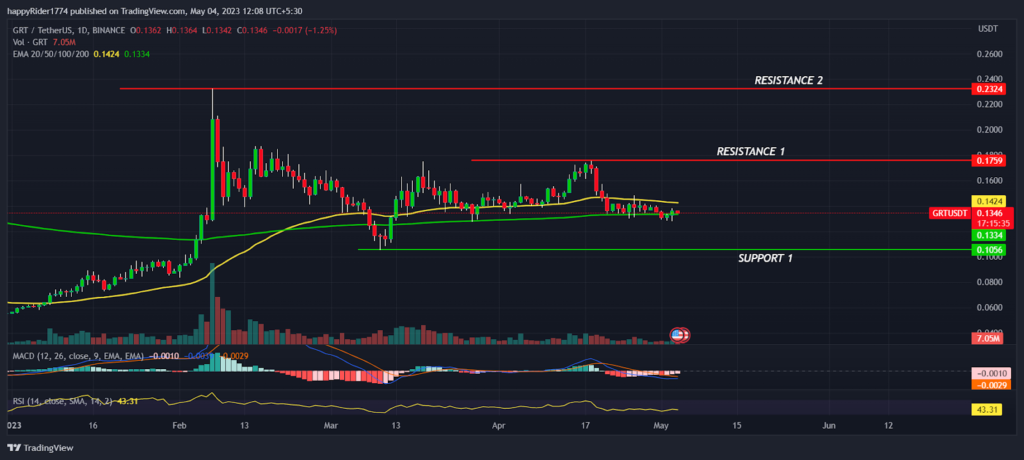
The Graph price downfall halted at $0.1056 and formed a bullish hammer candle. Later, price showed a minor recovery and tried to recover the losses. But it lacked the upside momentum and got stuck into the narrow range of consolidation.
Till GRT price sustains $0.1056 level the long term investors are safe and probability of taking U-turn remains high. On the other hand if the price dropped below $0.1056 then it will trigger negative sentiment.
Moreover bears may try to drag it down to the yearly lows. The technical analysis suggests Graph price is in bulls grip and any short term correction will have high probability of bouncing back from support.
GRT price lacked direction
GRT price forming Doji candle on a weekly timeframe shows prices lacked direction. It might consolidate for some more time before deciding the direction. The GRT price will pick up momentum when buyers succeed to break out of the $0.1759. Till then it is expected to trade in range.
The technical indicators like MACD had generated a negative crossover but the curve is reversing upward. It indicates mild bullishness and buyers seem to be returning back to the track. The RSI at 43 sloping sideways denotes prices are near to neutral territory and equal level of tug of war between buyers and sellers.
Conclusion
The Graph price witnessed profit booking from the higher levels and buyers are trying to defend the 200 day EMA. The GRT price seems to be stuck in the narrow range and showing signs of base formation. The technical analysis suggests, Graph price is in bulls grip and short term correction will have high probability of bouncing back.
Technical levels
Resistance levels : $0.1759 and $0.2324
Support levels : $0.1056 and $0.0800
Disclaimer
The views and opinions stated by the author, or any people named in this article, are for informational purposes only. They do not establish financial, investment, or other advice. Investing in or trading crypto assets comes with a risk of financial loss.

With a background in journalism, Ritika Sharma has worked with many reputed media firms focusing on general news such as politics and crime. She joined The Coin Republic as a reporter for crypto, and found a great passion for cryptocurrency, Web3, NFTs and other digital assets. She spends a lot of time researching and delving deeper into these concepts around the clock, and is a strong advocate for women in STEM.


