
 Home
Home News
News
- 1 GateToken Price forming a bullish continuation pattern.
- 2 GT price sustained above both EMAs and displayed a golden crossover.
- 3 Gate token price trying to sustain the price above $5.00.
Gatetoken Price recovered 20% approx from the recent low at $4.300 and formed a bullish continuation pattern. GT token price rising upward by forming higher high swings shows the strength of the bulls.
Gatetoken price is sustaining above the 200-day EMA showcase positional trend is in the upward direction. However, in the past few days, prices have been consolidating near the supply zone, indicating exhaustion.
GateToken price is trading at $5.2140 with an intraday decline of -1.35%. The 24-hour volume-to-market cap ratio is 0.0018. At the beginning of January, Gatetoken price downfall halted near $3.00 and took a U-turn. Buyers managed to climb above the 50-day EMA, which triggered the positive sentiment and turned the short-term trend in the upward direction.
Slow and steadily, prices began to rise and rallied 94% approx in the period of a few months. The momentum halted near $5.50, and prices witnessed minor profit booking from the supply zone. However, the 50-day EMA day acted as strong support, and prices bounced back with strong momentum. The trading volume is in the declining phase indicates fewer participants are active, and prices may consolidate for some more time.
Will GateToken Price continue the momentum?
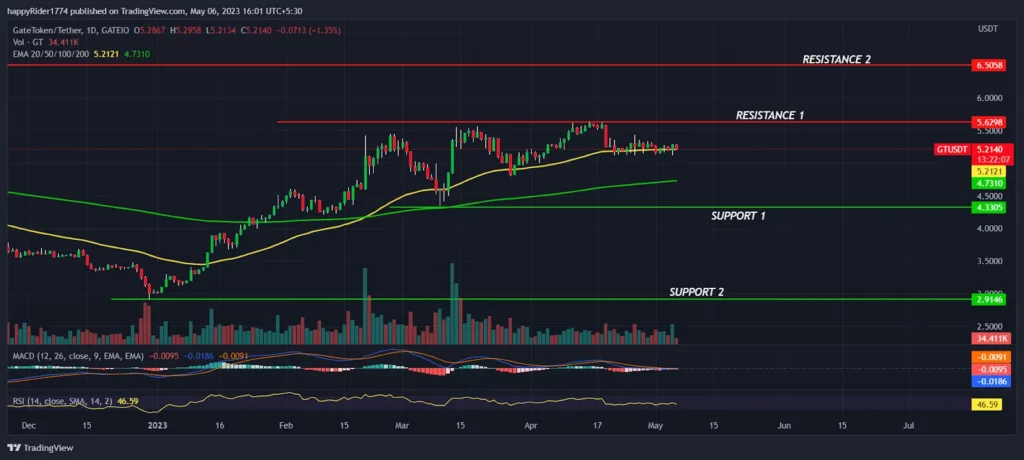
Gatetoken price breakout of the pre-FTX collapse level and sustaining on higher levels. It shows that responsive buyers are active and short-term correction will likely bounce back from lower levels. If buyers break the $5.500 hurdle, then prices might begin the rally to reach $8.00.
On the other hand, if the price drops below $4.3300, it may raise concerns for long-term investors. The technical analysis suggests that the Gatetoken price is in an uptrend, and the price might continue the upward momentum.
GT price shows exhaustion on the supply zone
GT price is forming a Doji candle weekly, showing price exhaustion. However, the price will increase momentum when it breaks out of the previous swing high at $5.500. The prices have rallied much and might enter into a wide range of consolidation before deciding the further direction.
The MACD curve generated by a negative crossover indicates mild bearishness. The RSI at 47 sloping sideways denotes neutral territory and an equal level of tug of war between buyers and sellers.
Conclusion
GateToken price performed well in the past few months and generated decent returns for long-term investors. GT price is forming a bullish continuation pattern, and buyers seem more active than sellers. The technical analysis suggests,
Gatetoken price is in bulls grip, and any short-term correction will likely bounce back from the lower levels.
Technical levels
Resistance levels: $5.5000 and $6.5000
Support levels: $4.300 and $3.0000
Disclaimer
The views and opinions stated by the author, or any people named in this article, are for informational purposes only. They do not establish financial, investment, or other advice. Investing in or trading crypto assets comes with a risk of financial loss.

With a background in journalism, Ritika Sharma has worked with many reputed media firms focusing on general news such as politics and crime. She joined The Coin Republic as a reporter for crypto, and found a great passion for cryptocurrency, Web3, NFTs and other digital assets. She spends a lot of time researching and delving deeper into these concepts around the clock, and is a strong advocate for women in STEM.


