
 Home
Home News
News
- 1 APE coin shows a bearish outlook on the daily charts.
- 2 APE is near its crucial support zone of $3.300
Apecoin is looking weaker in the last weeks, as the price is struggling near the support mark of $3.300. The buyers are losing the momentum which they gained in the past months. The sellers are now gaining traction and continue to make short positions.
Bulls are trying to accumulate coin price, but instead of a bounceback price is continuing to slip and resulting in holding near the demand zone near $3.000. Moreover, the recent price action indicates that the coin is breaking its support mark of $3.800 and trades below the 20-day EMA. This down move opens the other down trajectory swing of $3.000 to retest in the upcoming sessions.
Apecoin is trading below the primary significant moving averages and hovering near its crucial psychological level of $3.500. If any further downside arises, more aggressive selling continues, and the price will fetch the next support mark of $3.000. Buyers are targeting to bounce and bring 20 day EMA mark to claim neutral levels to avoid rash selling.
When writing, APE is trading at $3.574 with an intraday drop of 3.50% showing selling pressure on the coin. Moreover, the pair of APE/BTC is at 0.0001237 satoshis with a decline of 2.05%. The trading volume also significantly dropped 7% in the overnight session.
Apecoin on the Daily Charts
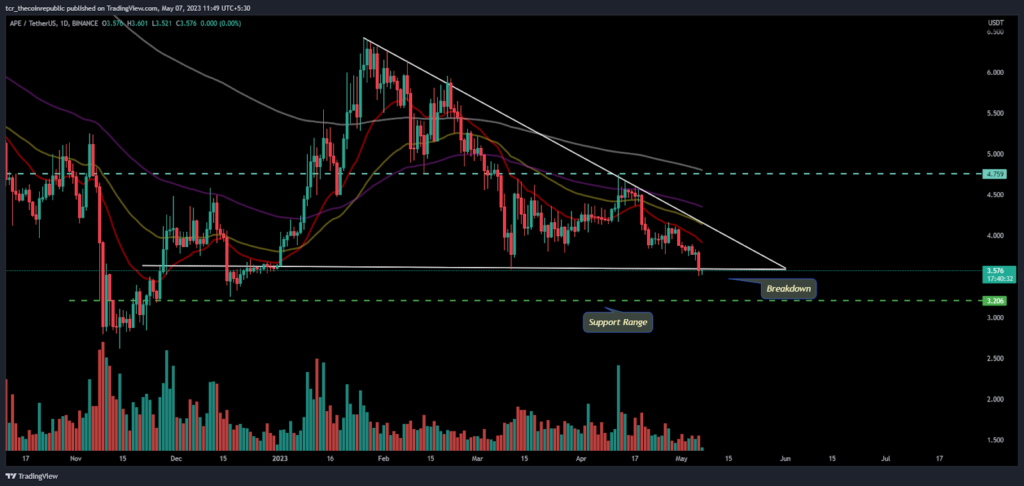
On the daily charts, Apecoin is breaking the bottom line of the ascending triangle pattern, and volume confirmation is awaited now. If further downside with volume arises, the price will retest the next support mark of $3.200. Furthermore, the price action indicates that the coin is not showing any decisive moves and stays in suspense, with trading on the verge of support. Moreover, the parameters show that rising wedge formation supports a bounce, while the bottom breakdown becomes a concern. APE is near its crucial support, so investors have to watch the levels and the move precisely.
Apecoin price is breaking the lower Bollinger band and shows a breakdown confirming that the indicator favors a down move. Furthermore, Fib retracement shows that the price is taking support at the 23.6% level in the last session. If APE starts to trade below the level, the next support level will be $3.000.
Short Term Charts of APECOIN
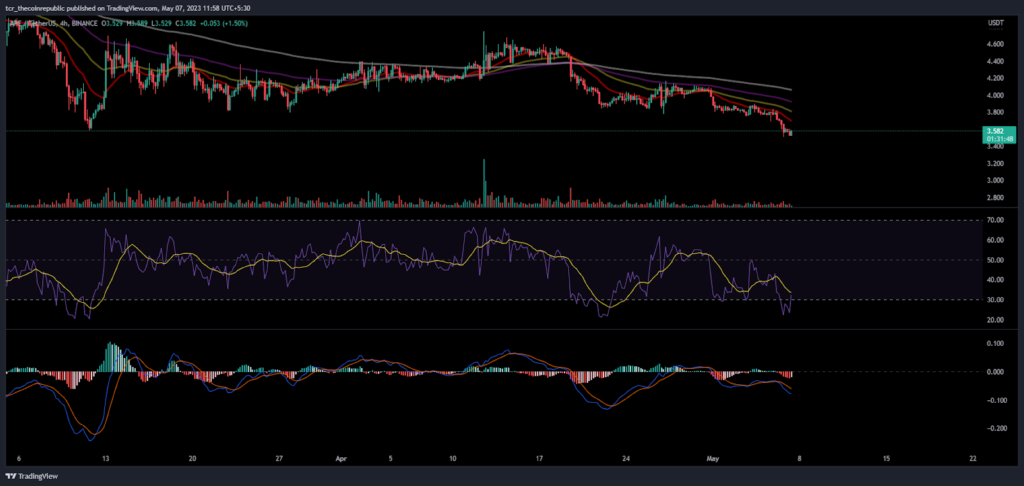
On the 4-hour charts, APE slips below the 20-day EMA, showing bearish cues. Moreover, the RSI curve in the oversold region shows selling pressure. However, a bounce as a retracement before further selling can be seen from the oversold territory in the upcoming sessions. The MACD indicator also shows that after registering a bearish crossover, the coin delivers down moves without pausing near the support mark.
Conclusion:
APE is at a make-or-break level near the crucial support mark, and further moves will be taken as an opportunity.
Technical Levels:
Support Levels:$3.00
Resistance Levels:$3.80
Disclaimer
The views and opinions stated by the author, or any people named in this article, are for informational purposes only and do not establish financial, investment, or other advice. Investing in or trading crypto assets comes with a risk of financial loss.

Andrew is a blockchain developer who developed his interest in cryptocurrencies while pursuing his post-graduation major in blockchain development. He is a keen observer of details and shares his passion for writing, along with coding. His backend knowledge about blockchain helps him give a unique perspective to his writing skills, and a reliable craft at explaining the concepts such as blockchain programming, languages and token minting. He also frequently shares technical details and performance indicators of ICOs and IDOs.


