
 Home
Home News
News
- 1 BCH’s price is currently trading at $116.7 while seeing a change of 14.08% in 24-hour trading volume.
- 2 BCH’s price is currently trading at $116.7 while seeing a change of 14.08% in 24-hour trading volume.
BCH’s price is attempting to break out of its critical resistance level near the 100 and 200 EMA. It has been trading on an uptrend since gaining buyers’ support near early November when it broke out of the bear’s firm hold over the price. Presently the investor’s sentiments are trading near the fear zone though it may change if the price takes a rebound around the trendline.

If the price gains investor’s support from the trend line it can rally up 15% within a week. The BCH price has been gaining consistent support of buyers from the trendline for the last 24 weeks. The price has been making multiple attempts to make a breakout through its critical resistance level however success eludes the buyers.

BCH price is facing critical rejection from the 200 EMA
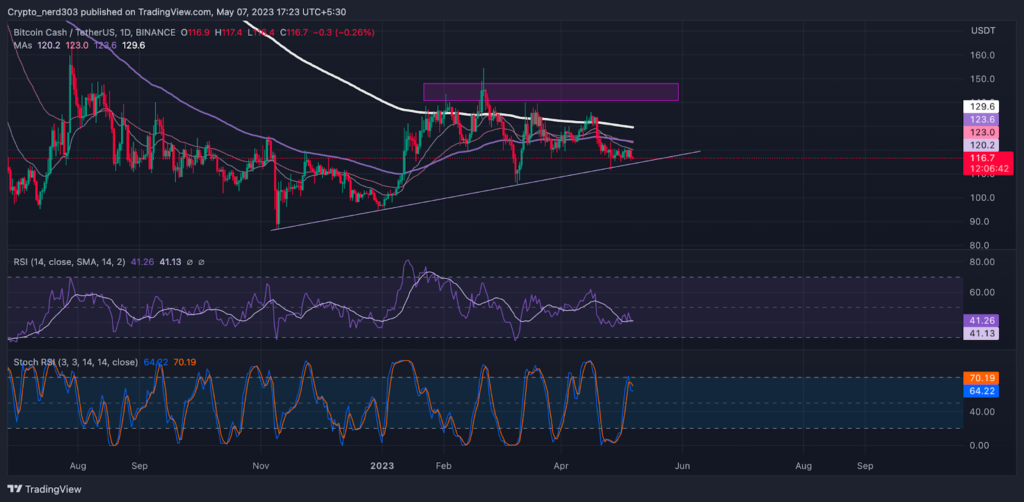
Obesrving the historical price action it can be analyzed that the price of BCH made a breakout through its resistance levels near the 100 EMA. After gaining bulls aid near $90 the price made an extremely bullish rally and saw a surge of 75%. Though despite the bullish sentiments of the investors it is yet to escape the danger zone.
If the price is not successful in crossing above its barriers in the form of 100 and 200 EMA it may fail to change its trend. The price of BCH at present is seeing a decline of 15% within the last couple of days after taking rejection from the 100 EMA.
Technical Analysis ( 1 Day Timeframe )
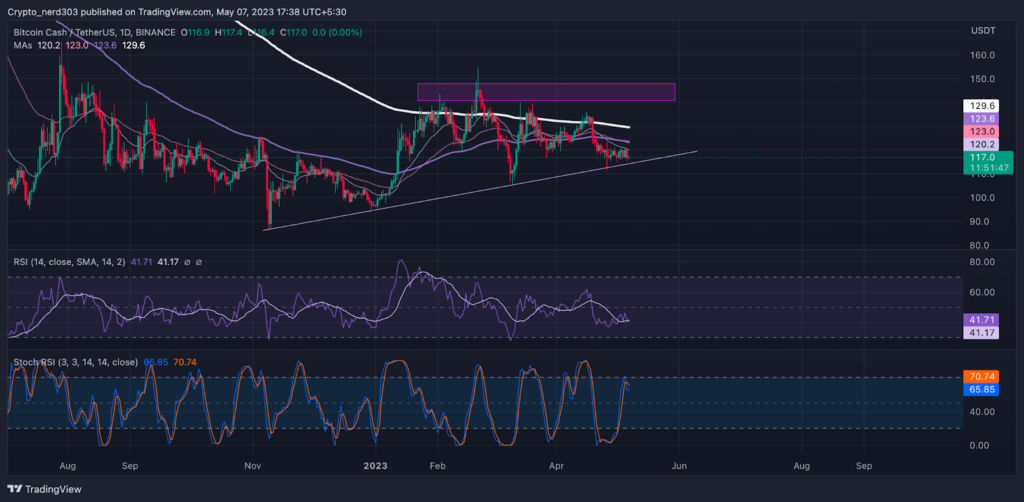
Presently the price is consolidating near the demand zone. It is attempting to make a bullish rebound from the trend line at $115. The RSI line has been trading just above the 14 SMA as of late. The current value of RSI is 41.71 points whereas the 14 SMA is providing resistance to it at 41.17 points.
The stochastic RSI seems to be taking a reversal from the 70 points. The current value of stochastic RSI is 65.85 points. The %K line has given a bearish interception to the %D line.
Conclusion
If the buyers are successful in propelling the price up with strength it can see an increase of 11 to 15% in the near future. The price has not given a close below the trendline within the last 6 months which increases the probability of a rebound despite strong resistance levels.
Technical levels –
Support –$110.0 and $100.0
Resistance – $150.0 and $130.0
Disclaimer
The views and opinions stated by the author, or any people named in this article, are for informational purposes only, and they do not establish financial, investment, or other advice. Investing in or trading crypto assets comes with a risk of financial loss.

Andrew is a blockchain developer who developed his interest in cryptocurrencies while pursuing his post-graduation major in blockchain development. He is a keen observer of details and shares his passion for writing, along with coding. His backend knowledge about blockchain helps him give a unique perspective to his writing skills, and a reliable craft at explaining the concepts such as blockchain programming, languages and token minting. He also frequently shares technical details and performance indicators of ICOs and IDOs.


