
 Home
Home News
News

- 1 The ICP coin is trading at $5.83 (press time) while seeing a change of -27.03% in 24-hour trading volume.
- 2 The ICP price declined by 1.71% in the last 24 hours.
The ICP price recently made an extremely bullish recovery of 50% within the last few weeks after breaking the symmetrical triangle. The Investor’s sentiments have been positive regarding the ICP price though a slight bearish correction is observed within the previous few weeks. The price suggests that it can attempt to make another bullish move in the future.

ICP token is making a lower high lower low and higher high higher low pattern. The price action suggests that the price can make another Symmetrical triangle as the lower high and higher low is a signature moves in the making of the pattern. The price action indicates that the trading force is building up with the declining movements. Investors may keep a keen watch on the volumes for any sudden spike as was observed in the previous breakout.

ICP Price May Continue the Bullish Rally (1-Day Timeframe)
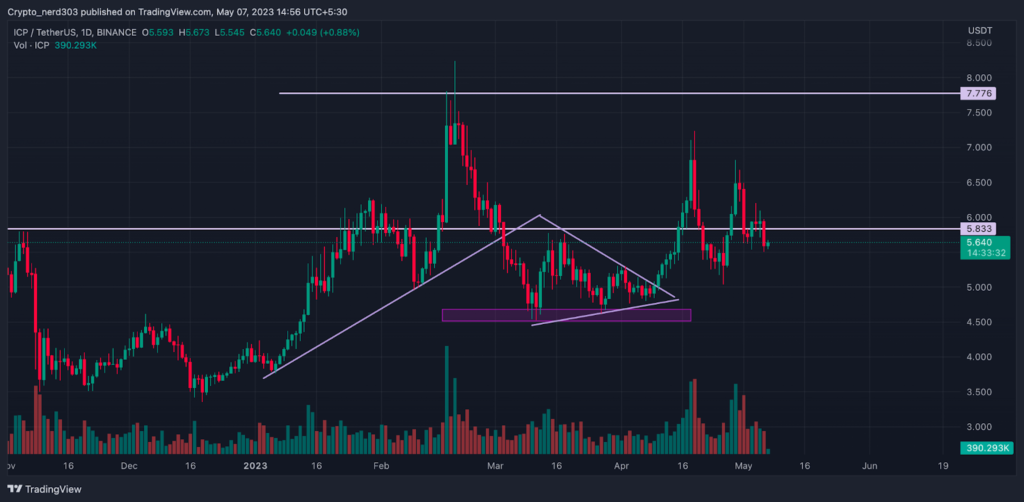
ICP price is presently making another symmetrical triangle. After marking its new 52-week low in late December, the price has been constant buyers’ support. Previously, it took support from the $3.500 and started trading on a bullish trend, the price recovered more than 96% of its overall value. However, despite the strong support from the bulls, ICP’s price was not successful in breaking above its 200 EMA resistance.
After facing a critical rejection the sellers stepped into action, making a bearish Doji candle pattern, the price took a downfall following a 37% downfall.
Technical Analysis (1 Day Timeframe )
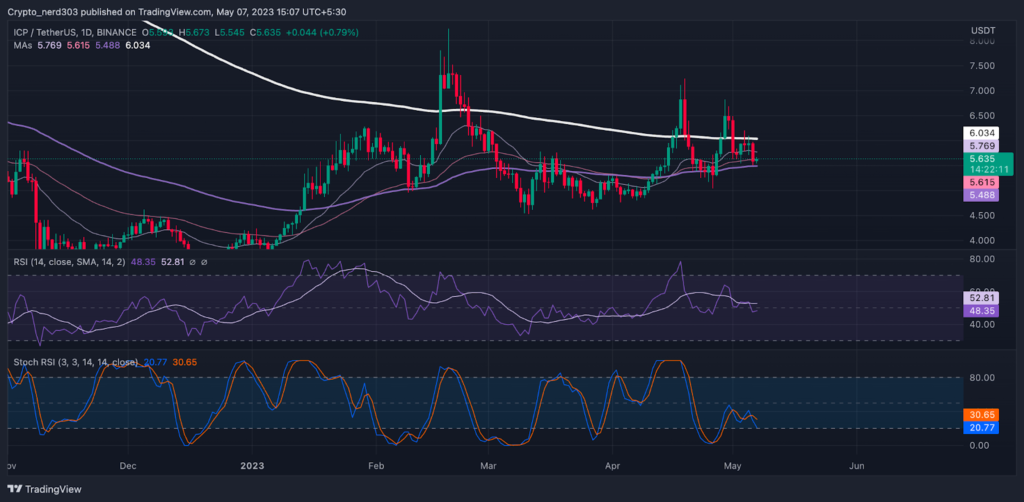
In the previous analysis, it was estimated according to the making of a wedge-like pattern with the bullish indication of the oscillators that the price can make a bullish breakout. This was proven correct when after taking support from the previous support level the price made an exceedingly bullish upturn of 50% within the next 2 weeks.
The RSI line is currently making a higher-high and higher-low pattern suggesting that it might give a positive crossover above 14 SMA; the stochastic RSI is trading near 30 RSI points.
Conclusion
At present, the ICP price is making an attempt to cross above the 200 EMA resistance level. The price has been making trading on an uptrend after gaining support from the price of $3.500 and currently, it is taking constant retest from the 200 EMA. Observing current analysis it is bound to either take a severe resistance from the current zone or make a significant breakout. This move suggests that the buyers are attempting to recapture the market.
Technical levels –
Support -$4.500
Resistance – $7000
Disclaimer
The views and opinions stated by the author, or any people named in this article, are for informational purposes only and do not establish financial, investment, or other advice. Investing in or trading crypto assets comes with a risk of financial loss.

Nancy J. Allen is a crypto enthusiast, with a major in macroeconomics and minor in business statistics. She believes that cryptocurrencies inspire people to be their own banks, and step aside from traditional monetary exchange systems. She is also intrigued by blockchain technology and its functioning. She frequently researches, and posts content on the top altcoins, their theoretical working principles and technical price predictions.


