
 Home
Home News
News
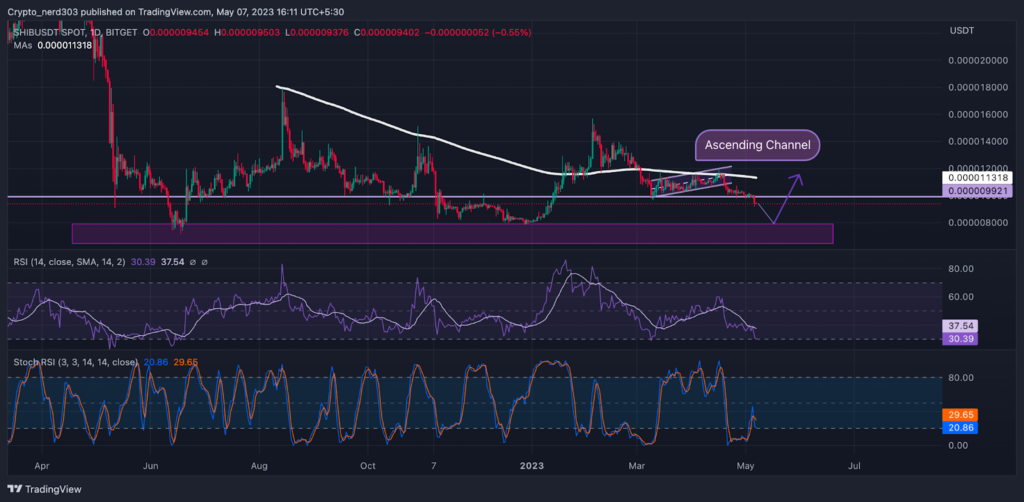
- 1 SHIBA’s price is currently trading at $0.0000093 with a 69.37% drop in the 24-hour trading volume.
- 2 The price of SHIBA is up by 3.09% in the last 24 hours.
- 3 SHIBA’s price may see a sharp decline in the near future.
The price of SHIBA is indicating that it may see a further decline in its value. The SHIBA price has been making constant attempts to break above its severe resistance at 200 EMA. Currently, Investor’s sentiments regarding the SHIBA price are falling further in the fear zone.
Despite its bullish recovery near early January where the price gained more than 90% of its value, the SHIBA token has not been able to make another breakout as of yet.
The SHIBA price is yet to attain its target and according to the analysis, the price may possibly give a further downfall of 17% within the upcoming week.
SHIBA May See A Further Downfall
The RSI is facing severe resistance from 14 SMA. Where on the other hand the Exponential Moving average and Simple Moving average are providing grave resistance to the SHIBA price on different levels. These price movements and indicators present an extremely bearish presepective because the majority of Investors respect these technical indicators and the display of these indicators in an identical direction strengthens the prediction.
Technical Analysis of SHIBA Price
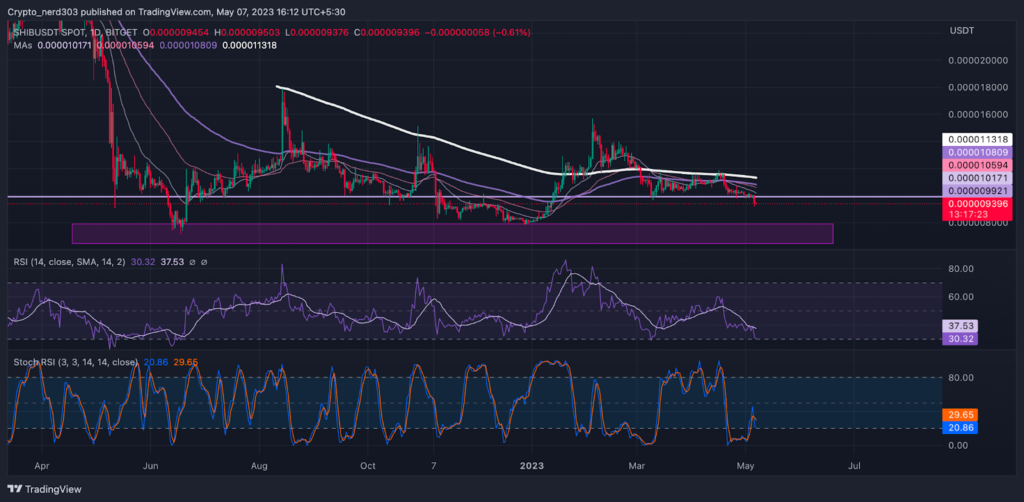
The price of SHIBA has recently crossed below its recent support level near $0.00000099 and it is making a strong red engulfing candle.
The RSI line is at present trading below 50 points and it is taking severe resistance from 14 SMA. The present value of the RSI line is 30.32 points whereas it taking rejection from the 14 SMA around 37.53 points.
The stochastic RSI after taking rejection from the median line is trading near 30 points. The %K line can take a bullish reversal as the 30 points is a strong support zone for the Stochastic indicator though the %K and %D lines have not respected it previously.
Conclusion
The price of SHIBA is favoring the bears. If the price takes a rejection from the current level it may make a critical downfall of 18%. Though the oscillators RSI and Stochestic RSI indicate that a bullish rally may occur before the price attains makes a bearish move and
The price of SHIBA is at present facing severe resistance from major EMA and MA levels. However, observing the price action that a bullish rally may take a form of consolidation or the price can also give a direct breakdown.
Technical levels
Support – $0.0000160
Resistance – $0.0000080
Disclaimer
The views and opinions stated by the author, or any people named in this article, are for informational purposes only, and they do not establish financial, investment, or other advice. Investing in or trading crypto assets comes with a risk of financial loss.

Nancy J. Allen is a crypto enthusiast, with a major in macroeconomics and minor in business statistics. She believes that cryptocurrencies inspire people to be their own banks, and step aside from traditional monetary exchange systems. She is also intrigued by blockchain technology and its functioning. She frequently researches, and posts content on the top altcoins, their theoretical working principles and technical price predictions.


