
 Home
Home News
News

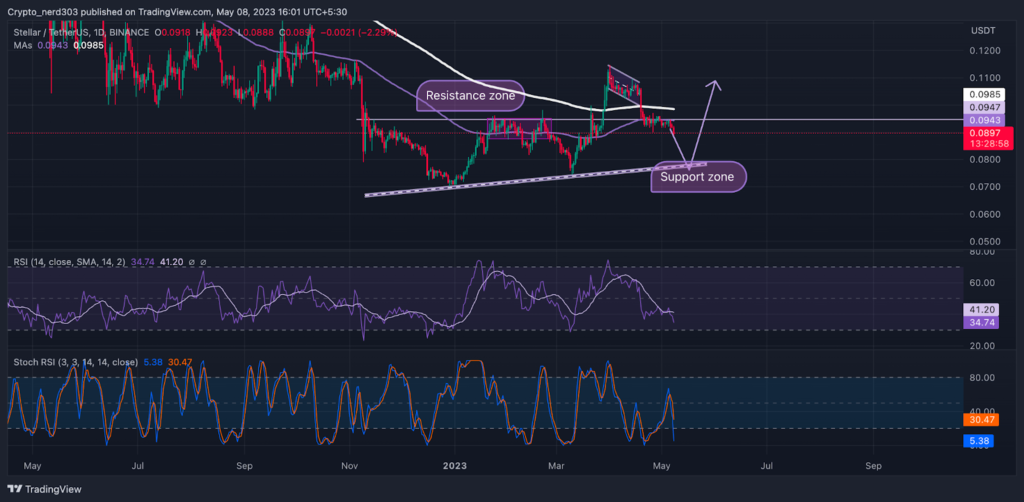
- 1 The XLM price is currently trading at $0.0897 while seeing a change of 47% in 24-hour trading volume.
- 2 The XLM price is observing a decline of 2.99% in the last 24 hours.
- 3 The XLM price made a negative breakout through the 200 EMA on Daily Timeframe.
The XLM price is currently taking a bearish divergence after breaking below the 200 EMA since its recent bullish rally. The sentiments of the investors are steadily moving toward the fear zone and are predicted to see a further decline in the price. Steller has been making constant higher highs and higher lows since gaining bulls’ attention near early January.

Around the time the sentiments of the overall market were experiencing a significant increase in buyers with the bullish surge in major cryptocurrencies.

XLM price may continue to move in a downtrend (Daily Timeframe)
Recently, the XRP price made a positive attempt to reclaim its previous bull trend by gaining substantial buyer support near early March. After taking support from $0.750 the price surged up by more than 50%. Though despite gaining significant support from the investors the price was not able to sustain above the 200 EMA. Consolidating under a decending channel for a few weeks XLM’s price broke its support level with an extremely bearish engulfing candle.
After making the bearish downturn the XLM price has been consolidating within a narrow range near the 100 EMA on the daily timeframe.
Technical Analysis ( 1 Day Timeframe )

The XLM price recently made an extremely bearish EMA crossover where the price, after crossing below the 20/50/100 EMA, made a breakdown below the 200 EMA.
Presently, the faster-moving exponential moving averages are making an EMA convergence, which is often observed before a significant breakout. These breakouts are mostly predicted to be made either in a bullish or bearish direction, However, in the Stellars’ instance, the price is currently trading below a major resistance level. Hence the chances are that after this breakout, the EMA’s divergence may continue moving in a downtrend.
The RSI line is currently moving in a downtrend; taking constant resistance from the 14 SMA. The current RSI value is 34.72 while the 14 line is trending near the median line around 42.30 points. The RSI line moving toward the oversold levels suggests that it may continue the bearish correction.
Conclusion
The analysis is suggesting that the price will make a major bearish move after taking resistance from the 200 EMA. Its most recent support is 12% below the current price of around $0.0800, while its recent barrier is around $0.1000.
Technical levels –
Support –$0.0800
Resistance – $0.1000
Disclaimer
The views and opinions stated by the author, or any people named in this article, are for informational purposes only, and they do not establish financial, investment, or other advice. Investing in or trading crypto assets comes with a risk of financial loss.

Andrew is a blockchain developer who developed his interest in cryptocurrencies while pursuing his post-graduation major in blockchain development. He is a keen observer of details and shares his passion for writing, along with coding. His backend knowledge about blockchain helps him give a unique perspective to his writing skills, and a reliable craft at explaining the concepts such as blockchain programming, languages and token minting. He also frequently shares technical details and performance indicators of ICOs and IDOs.


