
 Home
Home News
News
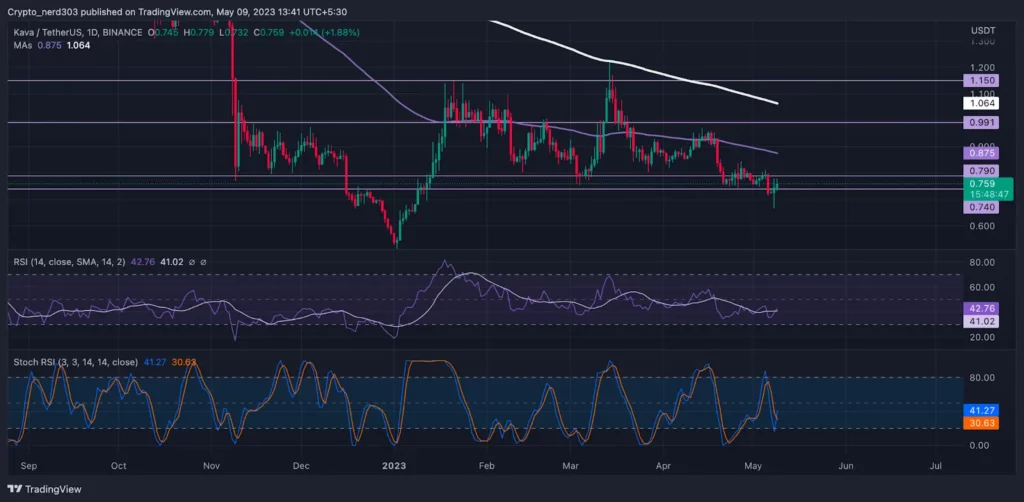
- 1 KAVA’s price is currently trading at $0.759 with an increase of 9.88% in the 24-hour trading volume.
- 2 KAVA’s price registered an increase of 7.51% in the last 24 hours.
The KAVA token is currently facing significant selling pressure on the daily timeframe. The token has declined 9% within the last 7 days. Near the end of March, sellers attempted to push the price down further though it gained buyers’ support from $0.740. It trades near its previous support zone after making a positive hammer candle.
However, despite the positive sentiments of the buyers, the recovery of the KAVA price may prove to be formidable. The price of KAVA has recently faced constant resistance from the major EMA levels on the 4 Hr time frame. Technical indicators are trading in bears’ favour though the Stochastic RSI is taking a bullish reversal from the oversold levels on the daily timeframe.
Will the Bulls Succeed in Supporting KAVA (Daily Timeframe)
KAVA is a layer-one blockchain. The KAVA platform includes an Ethereum Virtual Machine-compatible execution platform environment through which developers can benefit from the scalability and security of the all-inclusive KAVA network.
The KAVA network provides scalability, and through Tendermint consensus, it can support the transaction needs of multiple protocols in large amounts.
Technical Analysis (4 Hour Time frame)
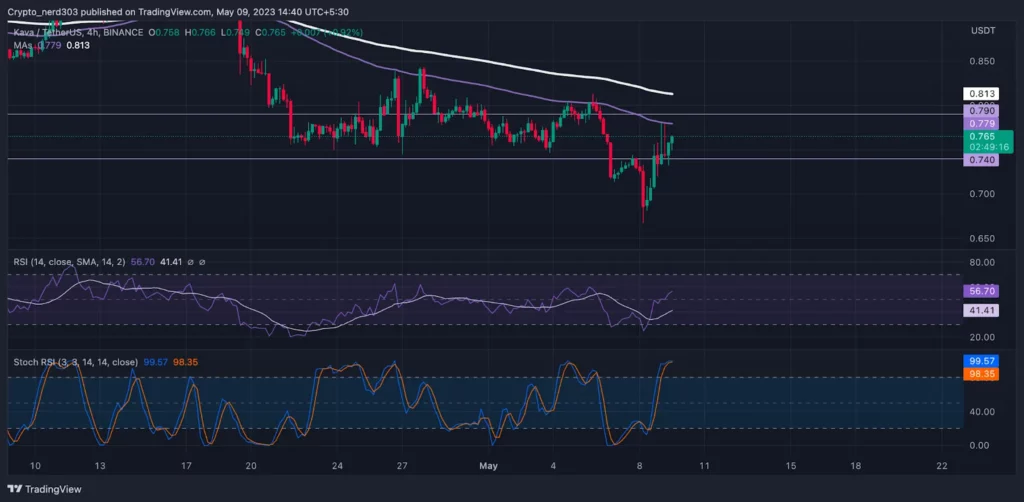
The RSI line recently crossed above the 50 points mark. The RSI line trades near 56.70 points above the median line; the 14 SMA provides support at 41.41 points. The RSI line is steadily reaching oversold levels, which mirrors the current price action as the price of KAVA also reaches its current resistance level near 100 EMA.
The Stochastic RSI suggests a bearish turn shortly as it trades around the oversold zone. The %K gives a negative crossover to the %D line. The current value of the Stochastic RSI is 99 points.
Conclusion
The price action of KAVA is giving bearish indications where the price is trading in the supply zone around 100 EMA on the 4-hour time frame, the price has been taking resistance from this level for the last couple of days.
The technical indicators support the bears in a shorter time frame, whereas, in a longer timeframe, the stochastic RSI has reached the demand zone.
Technical levels –
Support – $0.650
Resistance – $0.813
Disclaimer
The views and opinions stated by the author, or any people named in this article, are for informational purposes only and do not establish financial, investment, or other advice. Investing in or trading crypto assets comes with a risk of financial loss.

Andrew is a blockchain developer who developed his interest in cryptocurrencies while pursuing his post-graduation major in blockchain development. He is a keen observer of details and shares his passion for writing, along with coding. His backend knowledge about blockchain helps him give a unique perspective to his writing skills, and a reliable craft at explaining the concepts such as blockchain programming, languages and token minting. He also frequently shares technical details and performance indicators of ICOs and IDOs.


