
 Home
Home News
News
- 1 Render price is currently trading at $1.746 while witnessing a decrease of -6.08% during the intraday session.
- 2 The 24 hour trading volume of RNDR token is $132,180,433.
- 3 RNDR price is currently in a bearish trend on a daily basis.
Render Price Prediction, Render platform allows users to contribute their extra and unused GPU power from personal devices to various projects. RNDR token is an ERC-20 token that facilitates transactions between GPU providers and artists within the render network ecosystem.

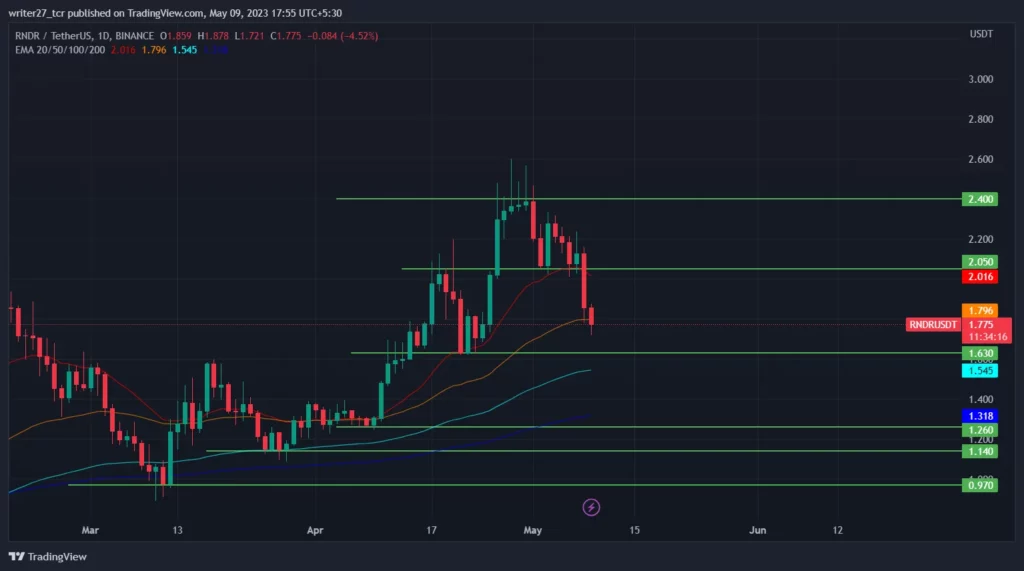
RNDR token is one of the biggest performers in the cryptocurrency market, rising from a low of $0.40 level to forming a high of $2.60 level, giving returns of approximately 542.60% at the end of April. During the beginning of May, the bullish trend shifted to bearish, pushing the price down to the $2.05 level, after which the price tried to retest the highs of the $2.60 level seized by active sellers at the $2.28 level.

Recently the support of the $2.05 level was breached by the bears driving the price down to the current level. RNDR’s price is currently headed toward the $1.63 level.
Release of Render’s Quarterly Report
Recently, Render’s quarterly report was released on May 3, stating that the network reported a surge in activity, with 840,804 frames rendered in March alone. Compared to the frames rendered and RNDR distributed, there was an increase from December 2022, which was positive for the price rising 10.26% on May 3.
If the Render Price Prediction can support the $1.63 price level, there is a higher probability for the price to again retest the annual highs after breaking above the $2.05 level. On the other hand, if the price can break the support of $1.63, there is a clean move for the price to reach $1.26, causing a downfall of approximately 21%, which might be seen as a pullback for the price as it has been in a bullish momentum from past four months.
RNDR Price is Headed Toward $1.63 Level Support
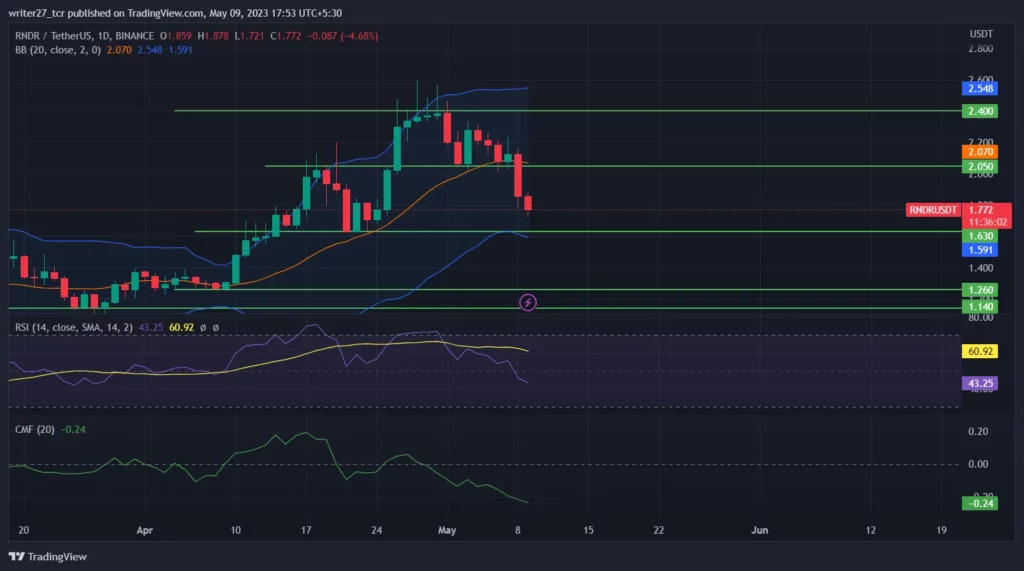
Chaikin money flow score is 0.24, indicating that weakness has struck the market with higher participation of sellers. RSI currently trades at 42.94, indicating bearish momentum in the market. As the price reaches the support zone, RSI might enter the oversold zone and give rise to chances of reversal. RNDR’s price is headed towards the lower band of Bollinger and has already crossed the 20-day SMA. The longs/shorts ratio is 0.92, with 48.04% longs and 51.96% shorts, indicating the increased short position in the last 24 hours and a higher probability that the price might reach the $1.63 level in the upcoming days.
Conclusion:
The market structure and price action for Render price have turned bearish after a strong bullish market for the past four months and becoming some of the best performers in the cryptocurrency market. The technical parameters indicate strong bearish momentum hovering around the RNDR price.
Technical levels:
Major support: $1.63 and $1.26.
Major resistance: $2.05 and $2.40.
Disclaimer
The views and opinions stated by the author, or any people named in this article about Render Price Prediction, are for informational purposes only. They do not establish financial, investment, or other advice. Investing in or trading crypto assets comes with a risk of financial loss.

Nancy J. Allen is a crypto enthusiast, with a major in macroeconomics and minor in business statistics. She believes that cryptocurrencies inspire people to be their own banks, and step aside from traditional monetary exchange systems. She is also intrigued by blockchain technology and its functioning. She frequently researches, and posts content on the top altcoins, their theoretical working principles and technical price predictions.


