
 Home
Home News
News

- 1 TRX/USDT is currently trading at $0.068 while seeing a change in 24 hours of 9.98%.
- 2 TRX’s price is seeing an increase of 1.19% in the last 24 hours.
The Investor’s confidence level is high regarding the TRX price across most of the cryptocurrency exchange platforms. The price action occurring in the TRX is also reflecting the buyer’s confidence in its movements as the TRX token has been respecting the trendline for the past 28 weeks though it may take a bearish correction in the shorter timeframe. The TRON has a total market cap of $6.2B; its circulating supply is 91B.

At present price of TRX is trading above the 50 EMA line after taking a reversal from the supply zone. It also made a bearish three-black crows candlestick pattern. The oscillators are taking a reversal of the overbought levels. According to this, the price may make a correction in the near future.

The TRX price makes a negative reversal (Daily Timeframe)

The price is currently moving according to the estimation given in the previous analysis. Despite making a breakout above the consolidation the strength of the breakout is not significant. The price was said to be expected to make a retest of 6 to 7% before the continuation of the trend.
After making another bullish attempt the price is trading 6% below its previous resistance level. It is expected to continue on a bullish trend as that is the path of least resistance for it.
Technical Analysis of the TRX Price on (1-Day Timeframe )
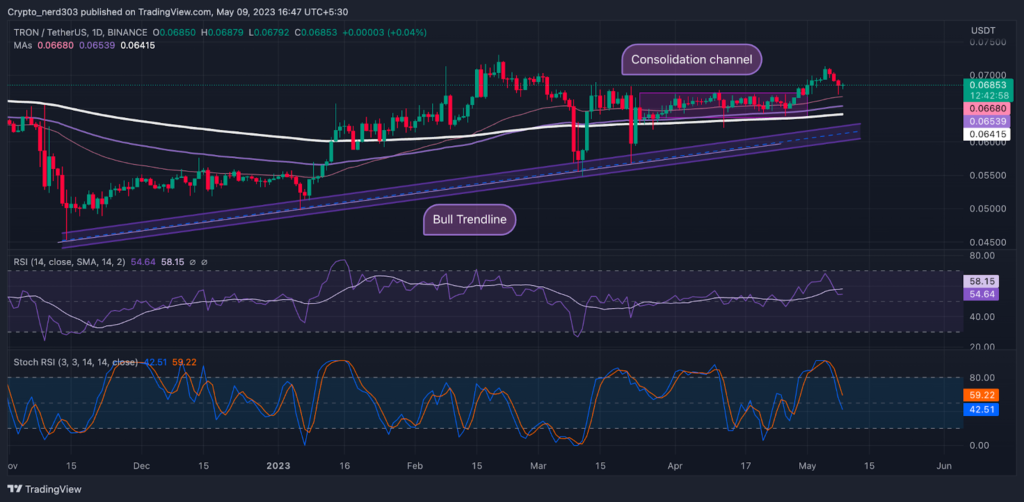
The RSI line has recently taken a reversal from the overbought zone also crossing below the 14 SMA. The current value of RSI is 54.64 point’s which is trading below the 14 SMA. The current value of 14 SMA is 58.15 points. The RSI line indicates that it can take a retest through the 14 SMA before continuing the trend.
Presently, the Stochastic RSI is steadily moving toward the oversold levels on the daily timeframe. %K line has already crossed below the median line and %D line is close behind it. The current value of Stochastic RSI is 42.51 points.
Conclusion
The price of TRX is currently taking support from the 50 EMA line though it may not be sufficient to hold the price according to the Oscillators. The price may take a retest from its 100 or 200 EMA before making a bullish reversal. TRX token may lose 7% of its value within the next week if dose not get buyers’ support on the daily timeframe.
Technical levels –
Support -$0.06000
Resistance – $0.07000
Disclaimer
The views and opinions stated by the author, or any people named in this article, are for informational purposes only, and they do not establish financial, investment, or other advice. Investing in or trading crypto assets comes with a risk of financial loss.

Nancy J. Allen is a crypto enthusiast, with a major in macroeconomics and minor in business statistics. She believes that cryptocurrencies inspire people to be their own banks, and step aside from traditional monetary exchange systems. She is also intrigued by blockchain technology and its functioning. She frequently researches, and posts content on the top altcoins, their theoretical working principles and technical price predictions.


