
 Home
Home News
News

- 1 IOTA/USDT is currently trading at $0.1790 while seeing a change in 24 hours of 1.71%.
- 2 IOTA price might continue to trade in a downtrend.
IOTA Price Analysis has been trading under the bear’s control for an extended period of time. The Investor’s sentiments are taking a bearish turn regarding the IOTA token. The price recently broke its Symmetrical triangle near early May with an engulfing red candle. It is estimated to see a further decline in the value after a retest according to the price action and technical indicators. IOTA’s price has a total market cap of 665.61M and its current Alt rank is 72nd.

Recently the price made an attempt to recover its bull trend after gaining buyers’ support near early January. It made a bull trend where the IOTA price gained more than 70% of its value. Despite gaining significant support from the buyers and making multiple attempts the price of IOTA was not able to prevail over the 200 EMA.

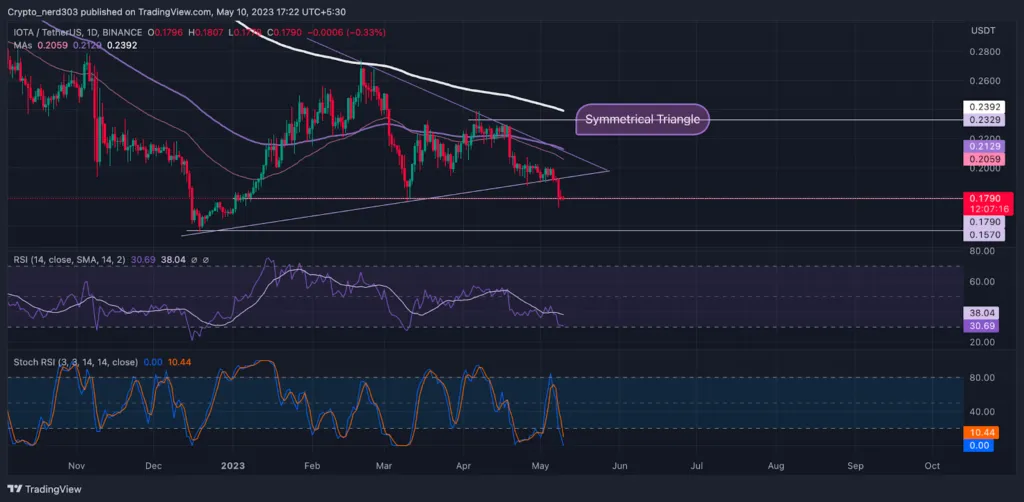
IOTA Price Analysis Faces Resistance From 200-day EMA (Daily Timeframe)
After taking support at $0.1400, near last December IOTA’s price made a bullish recovery of 43 percent. The price did try to break its critical resistance near the 200-day EMA however it couldn’t sustain above it. The price took a sharp rejection of 35 percent. The price recently broke its support level near $2.000 also disrupting its attempt to make a bull trend.
In the previous analysis, it was estimated that the price after taking rejection from the 200 Moving Average can take a further decline of 10%. The price made another attempt to break its 200 MA barrier but could not succeed. Currently, it is observing a decline of 21 within the last 3 weeks.
Technical Analysis (On 1 Day Time frame)
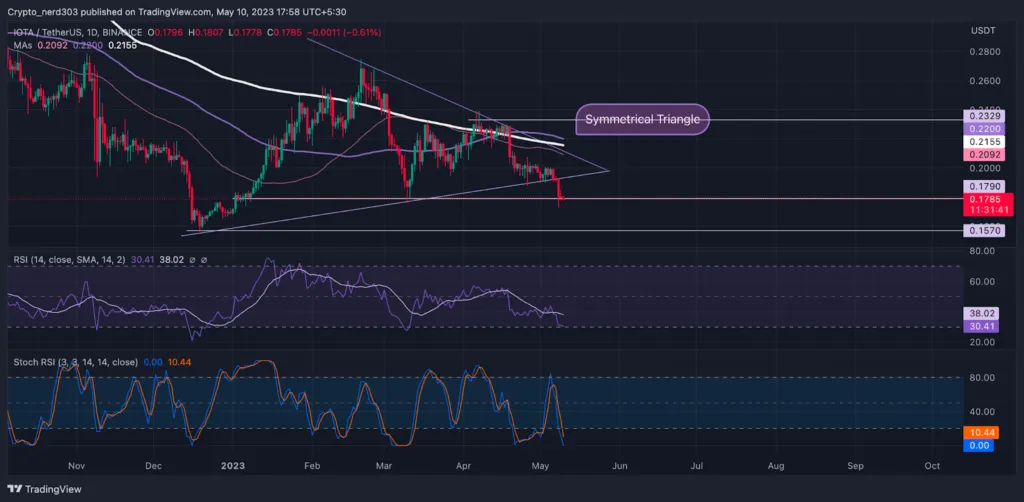
Presently, the IOTA Price Analysis is trading below the 200 EMA on the daily timeframe. The RSI line is trading near the oversold levels after taking rejection from the median line The current RSI value is 30.41 points while the 14 SMA is trading just above it at 38.02 points.
The Stochastic RSI has already reached an extremely oversold level. The %K line indicates that it may soon take a bearish reversal, Current value of the Stochastic RSI is 10.44 points.
Conclusion
As of now, according to the analysis IOTA’s price is trading under the bear’s control. The price broke its symmetrical triangle with an extremely bearish candle which indicates that the price may continue its bearing trend in the near future if it doesn’t gain buyers’ support from the recent support levels.
Technical levels –
Support – $0.1600
Resistance – $0.2000
Disclaimer
The views and opinions stated by the author, or any people named in this article about IOTA Price Analysis, are for informational purposes only, and they do not establish financial, investment, or other advice. Investing in or trading crypto assets comes with a risk of financial loss.

With a background in journalism, Ritika Sharma has worked with many reputed media firms focusing on general news such as politics and crime. She joined The Coin Republic as a reporter for crypto, and found a great passion for cryptocurrency, Web3, NFTs and other digital assets. She spends a lot of time researching and delving deeper into these concepts around the clock, and is a strong advocate for women in STEM.


