
 Home
Home News
News
- 1 The GRT price is currently trading at $0.1130 while seeing a change of 18% in the 24-hour trading volume.
- 2 The GRT price is observing.
- 3 a decline of 12% in the last 24 hours.
The GRT price is currently trading near a crucial support level on the daily timeframe. If it gains buyers’ support from the current level price it is predicted to see an increase of 53% within the next few weeks. Presently, it is trading near the demand zone around its previous support level. The current value of the GRT token is $0.113 and it has a market cap of $1.02B.

The majority of the technical Indicators are at present taking the bull’s favor. The price is gaining support from the 200 Moving average which may prove to be a crucial support zone in the near future. The Ocilators RSI and Stochestic RSI are at present trading near the demand zone.

The GRT price facing resistance from the 50 EMA (Daily Timeframe)
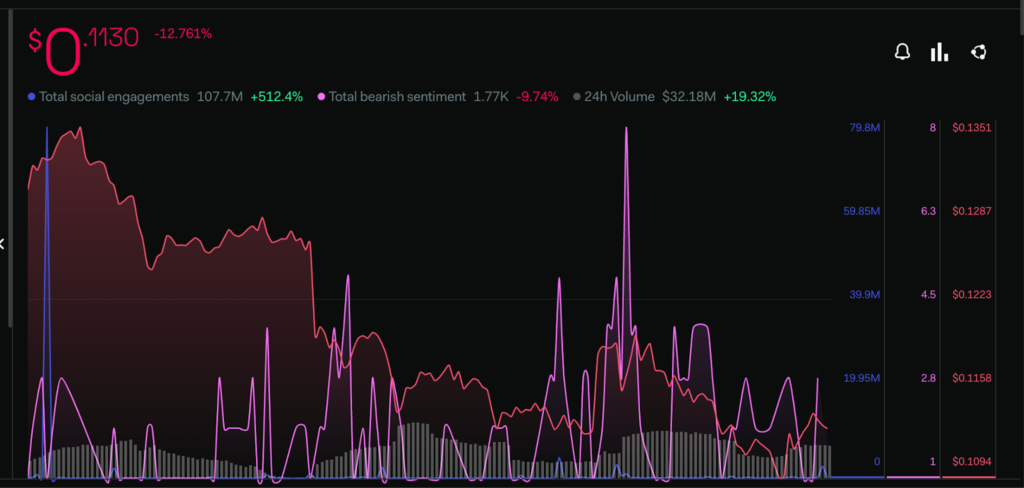
The Investor’s sentiments regarding the GRT price are taking a bullish turn; the Social engagement metrics are also recording an extremely positive surge of 512%. There is a slight decline in the bearish sentiments which suggests that investors are currently bullish regarding the GRT token and their interest is raising across various social platforms. The buyer’s bullish opinions may also get reflected in the price action in the near future.
Technical Analysis ( 1 Day Timeframe )
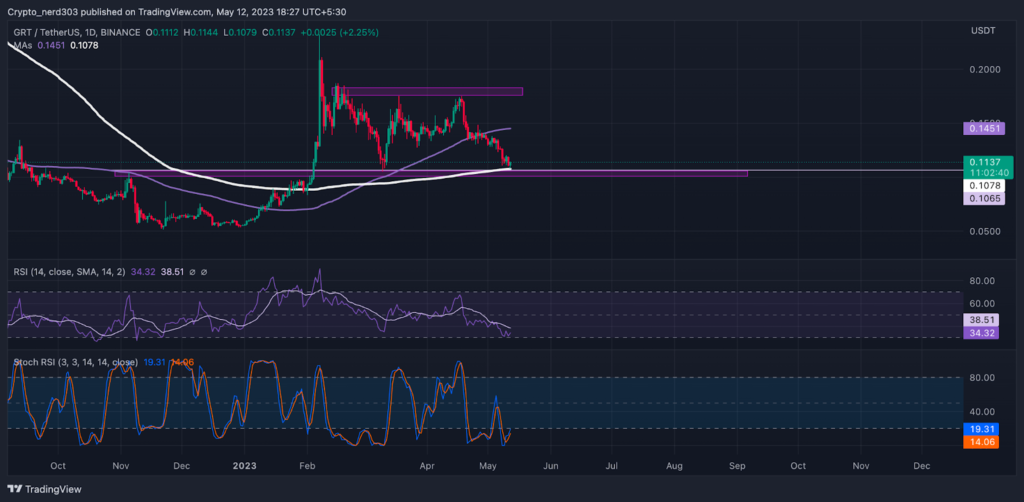
The GRT price is taking support from the 200 Moving Average. The price is currently trading near a critical zone if it gains buyers’ support from its recent support the GRT token has the potential to make a bullish move of 53% in the near future. Though the 100 MA is currently providing severe resistance to it.
The RSI line is at present taking resistance from the 14 SMA after crossing below the median line. At present, the RSI line is trading at 34.32 points, whereas the 14 SMA is trending just below the 50 RSI point at around 38.51 points.
At present, the stochastic RSI is trading near its extreme oversold levels. The %K line is giving a bullish interception to the %D line near 14 points. At present the value of the Stochestic RSI is 19.13 points.
Conclusion
According to the analysis, If the price is supported by the investors it can make an uptrend of 52% within the next few weeks reaching its target near $0.2000 and its nearest support zone is at the $0.1000 level. The majority of the technical indicators are supporting the bullish reversal.
Technical Levels:
Support –$0.2000
Resistance – $0.1000
Disclaimer
The views and opinions stated by the author, or any people named in this article, are for informational purposes only, and they do not establish financial, investment, or other advice. Investing in or trading crypto assets comes with a risk of financial loss.

With a background in journalism, Ritika Sharma has worked with many reputed media firms focusing on general news such as politics and crime. She joined The Coin Republic as a reporter for crypto, and found a great passion for cryptocurrency, Web3, NFTs and other digital assets. She spends a lot of time researching and delving deeper into these concepts around the clock, and is a strong advocate for women in STEM.


