
 Home
Home News
News
- 1 Solana price is currently trading at $21.18 while witnessing an increase of +1.34% during the intraday session.
- 2 SOL price trades below 20,50,100 and 200-day EMAs.
- 3 SOL price has escaped the upward channel.
Solana price was in an upward channel since the start of March forming higher highs and higher lows. The price has recently broken below the trend line and created a support at $20 level. The current price action shows that the price might be headed towards retesting the upward channel and moving further downwards.
Since the beginning of 2023, Sol price has been on the rise. Price created an annual high at $27.12 on Feb 20, followed by a drop to $16 level. The price then formed a bullish channel to again retest the annual highs.
Solana Price Breaks The Support Line Of Upward Channel
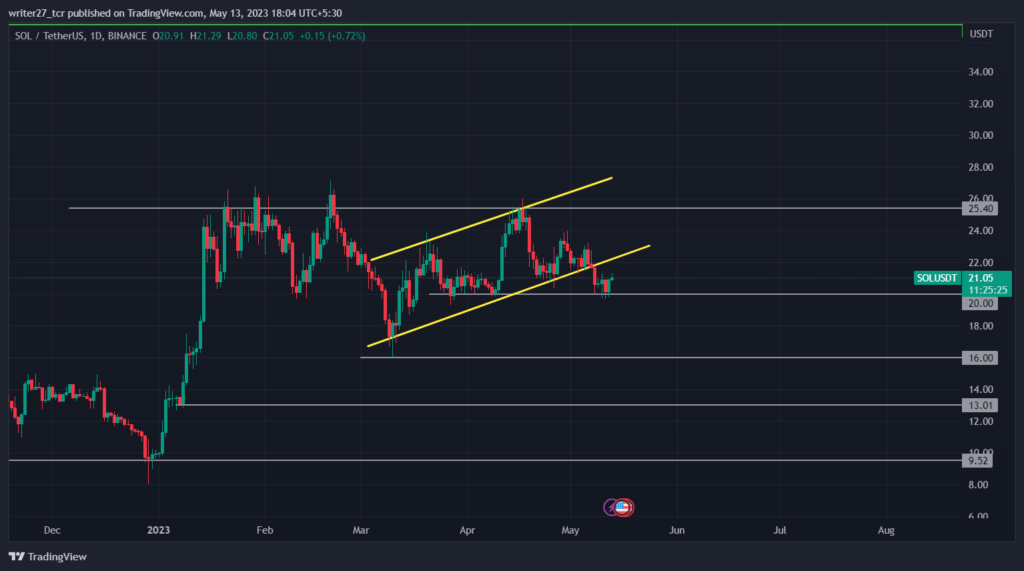
The break of support line of the upward channel happened after 59 days. The breakdown from the supporting trendline indicates the end of the upward trend. Like most of the Altcoins, Solana is also showing weakness in the market.
If Sol price is able to break below $20, there is a higher probability for the price to push down till $16 level. The support of $20 has held the price several times previously. The situation has been uncertain for US markets as if the macroeconomics situation were to improve in the face of decline in US inflation, investors could possibly witness a new inflow of capital in the crypto-market.
If price can rise above $23 level, there might be a possibility that it can reach $26 level and further more till towards the annual highs. As the Bitcoin is headed towards $27,000 today, Solana price has become one of the notable gainers from the large-cap Altcoin. The total crypto market capitalization has added over $30 Billion since yesterday and is currently $1.2 Billion.
What Technicals Say About Solana Price?
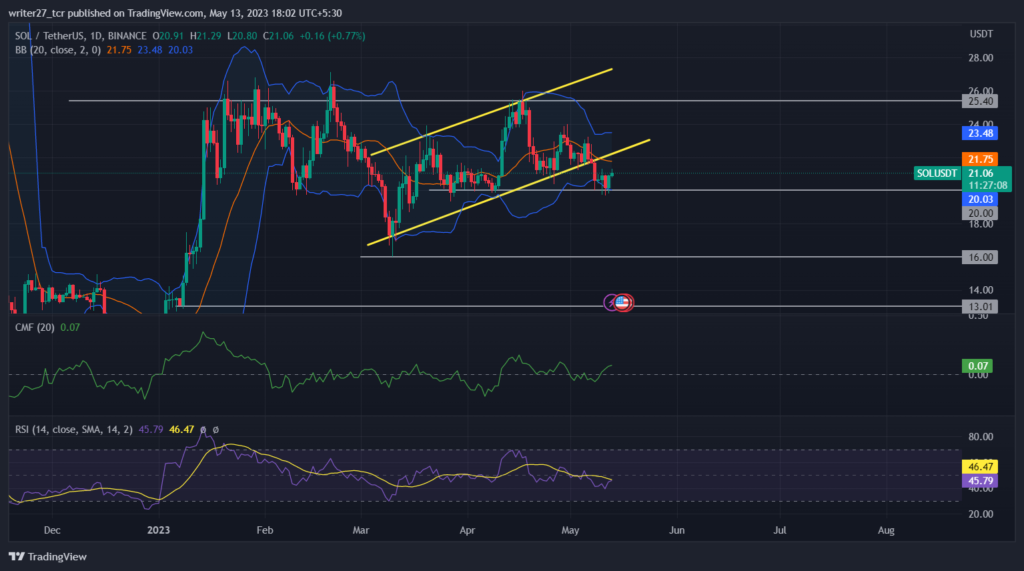
Sol price is trading below 20,50,100 and 200-day EMA indicating strong bearish momentum although price has formed support at $20 level. The price has started to rise and might cross 20,50 and 100-day EMA in upcoming days if bears are not able to break the support of $20. Chaikin money flow score crossed above 0 mark indicating increase in the strength of market. RSI trades at 46.06 entering the neutral zone with the same pressure from bulls as well as bears.
there is a possibility that prices might enter consolidation before making any major moves. The price has bounced off from the lower band of bollinger and is headed towards the upper band. The longs/shorts ratio is 0.98 with 49.46% longs and 50.54% shorts indicating an almost same level of position on both sides.
Conclusion:
The market structure and price action is currently bullish as price has formed support at $20 level. Although overall view favours the bearish side as price has recently broken the support line of the upward channel.
Technical levels:
Major support: $20 and $16
Major resistance: $25.40 and $26.30
Disclaimer
The views and opinions stated by the author, or any people named in this article, are for informational purposes only. They do not establish financial, investment, or other advice. Investing in or trading crypto assets comes with a risk of financial loss.

Nancy J. Allen is a crypto enthusiast, with a major in macroeconomics and minor in business statistics. She believes that cryptocurrencies inspire people to be their own banks, and step aside from traditional monetary exchange systems. She is also intrigued by blockchain technology and its functioning. She frequently researches, and posts content on the top altcoins, their theoretical working principles and technical price predictions.


