
 Home
Home News
News

- 1 The APT price is currently trading at $8.70; seeing a change of 16.9% in 24-hour trading volume.
- 2 The APT price is observing a decline of 4.44% in the last 24 hour
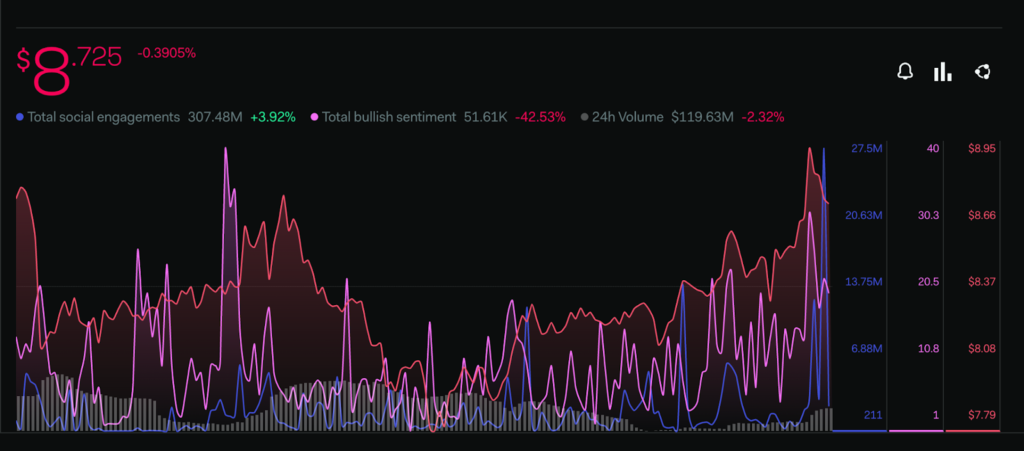
The Investor’s sentiments of the market regarding APT price are seeing a bearish decline within the past few weeks. Though the total engagement level of the token is observing a slight increment of 3.92%. This indicates that potential buyers of APT tokens are showing increasing interest across various communities on social media platforms. The buyer’s interest may soon get reflected in the price action of the APT as it is trading near an important support zone facing resistance from 200 EMA. It will require the support of the buyers to continue its bull trend.

The current value of APT is $8.70, it has a total Market Cap of $1.71B
Investors Sentiments Regarding the APT Price
Most of the major cryptocurrencies in the market at present are taking a bullish reversal after the recent bearish move. As the APT price moves in correlation with those Tokens the probability of the same being reflected in the price action is high.
The price of APT is at present making a higher high and low pattern after gaining support from $8.000. This is an important support level. If succeeds in breaking its recent barrier levels the APT price can gain more than 95% of its value. Investors may prefer to wait for confirmation before taking any action.
Technical Analysis ( 1 Day Timeframe )
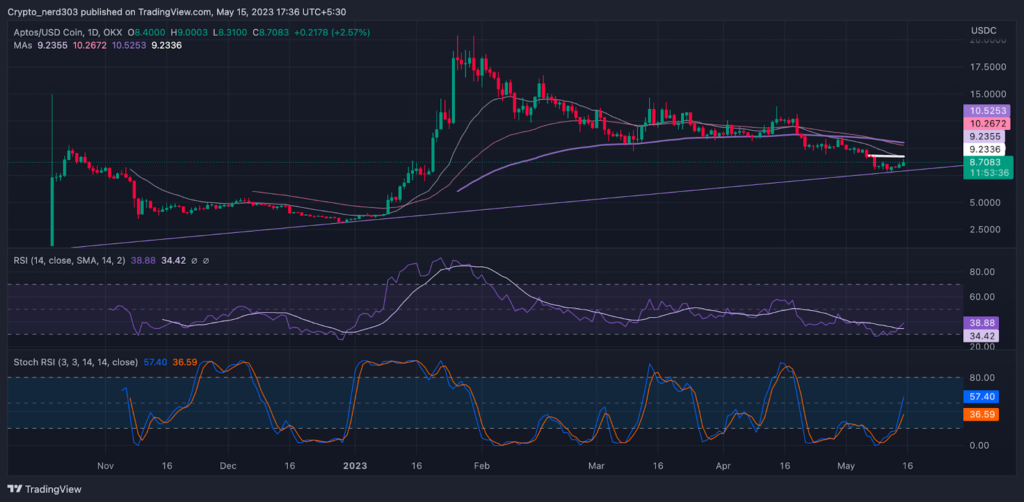
The technician indicators are taking the buyer’s favor on the daily timeframe. The Oscillators are trading in the oversold levels and the price is making a bullish curve after taking a reversal from $8.000. The price has multiple resistance levels to cross in order to make a bullish recovery.
The RSI line is moving above the oversold level at present and the SMA is providing resistance to it. Though, recently the RSI line gave a positive crossover. The current value of RSI is at 38.88 points; the 14 SMA line is trending below the median line around 34.42 points.
The stochastic RSI is making a bullish double-bottom pattern. The % D line is at 36.59 points and the %K line is at 57.40 points. The making of a bullish W pattern near demand levels may support the bullish recovery of the price.
Conclusion
APT price is presenting an overall bullish perspective for the near future. whereas the Oscillators are also giving a bullish indication of the daily timeframe.
Technical levels –
Support –$10.0000
Resistance – $13.000
Disclaimer
The views and opinions stated by the author, or any people named in this article, are for informational purposes only, and they do not establish financial, investment, or other advice. Investing in or trading crypto assets comes with a risk of financial loss.

Andrew is a blockchain developer who developed his interest in cryptocurrencies while pursuing his post-graduation major in blockchain development. He is a keen observer of details and shares his passion for writing, along with coding. His backend knowledge about blockchain helps him give a unique perspective to his writing skills, and a reliable craft at explaining the concepts such as blockchain programming, languages and token minting. He also frequently shares technical details and performance indicators of ICOs and IDOs.


