
 Home
Home News
News
- 1 The ZIL price is currently trading at $0.024 while seeing a change of 4.15% in 24-hour trading volume.
- 2 The ZIL price has been observing a decline of 1.47% in the last 24 hours.
The Zilliqa price saw a sharp bearish decline within the last few days. It is at present trading near a crucial support level on the daily timeframe. The price action suggests that it can take a bullish reversal shortly if buyers propel the price up with strong momentum. It is currently trading below all major EMA levels, which may prove to be challenging for investors to overcome in recent days.
The current value of Zilliqa is $0.024 and it has a market of 383.92M
A decline in TVL and the Price of ZIL
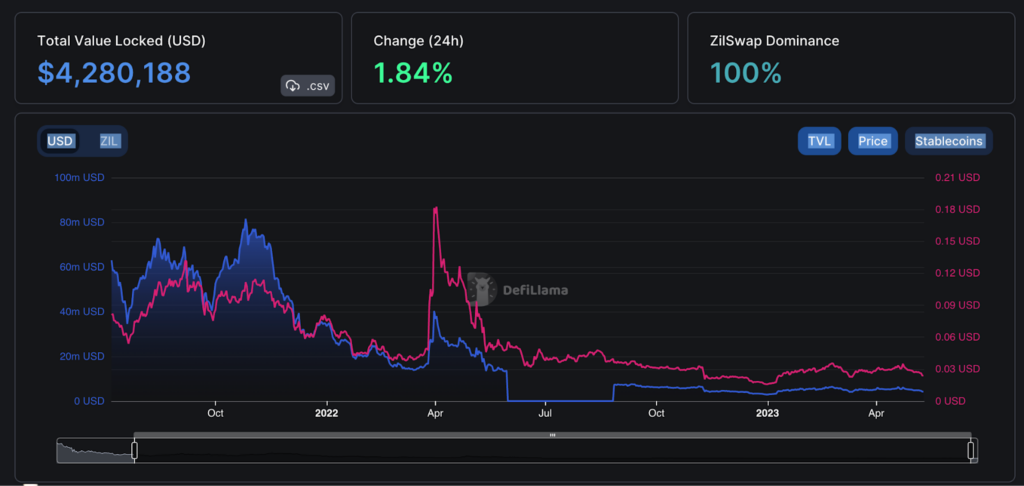
The Total Value Locked of the ZIL token is $4.280M, it has surged by 1.84% within the last 24 hours. The price and TVL value of ZIL price is observing a sharp decline since last October which suggests that buyers are presently hesitant about the token.
In the previous analysis, after taking a downturn of 22% within the last two weeks the price is estimated to take a further decline, before making a rebound from the trendline. It was also analysed that if ZIL’s price succeeds in making a rebound it may break its previous bear trend in favor of the bull trend.
This analysis was proven correct when after taking a reversal from $0.02747 the price continued its downfall and saw a further decline of 19%.
Technical Analysis
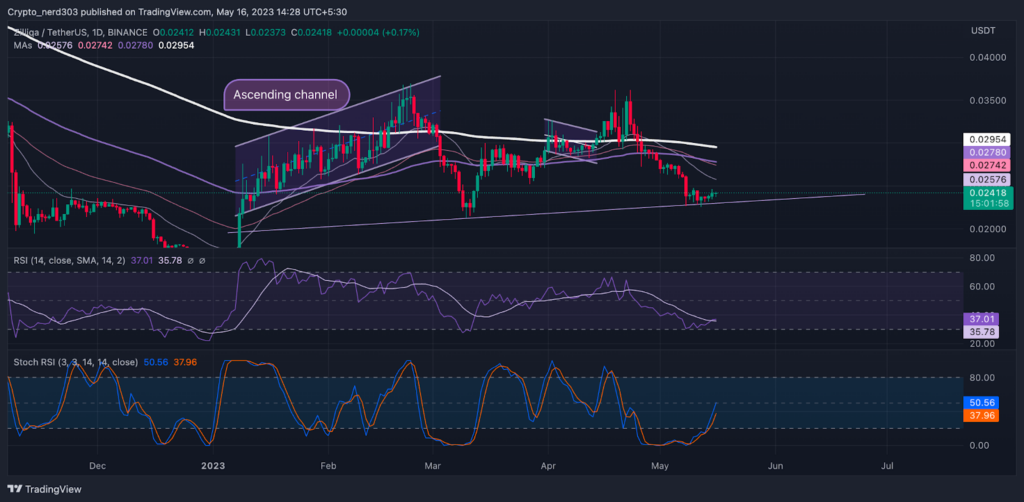
The RSI line is giving a positive intersection to the 14 SMA after making a recovery from the oversold levels. The current value of the RSI line is 37.29 points and it is taking resistance from 14 SMA around 35.78 points. The RSI line is presenting a bullish perspective for the near future.
At present, the support level for the ZIL price is around $0.2200 whereas the recent resistance point for the price of ZIL is near $0.2700 and its major resistance is at $0.2900
The stochastic RSI recently crossed above the oversold levels. The %K is about to intercept the median line and the %D line is moving above the 20 points. The Stochastic oscillator is bullish regarding the upcoming trend and it is steadily moving towards the supply zone on the daily timeframe.
Conclusion
The majority of technical indicators endorse the bulls. The Ocilators are at present trading near the demand zone; the 20 EMA line is also making a bullish curve. Though 200 and 100 EMA are giving resistance to the price.
Technical levels –
Support – $0.02200
Resistance – $0.02700 and $0.02900
Disclaimer
The views and opinions stated by the author, or any people named in this article, are for informational purposes only, and they do not establish financial, investment, or other advice. Investing in or trading crypto assets comes with a risk of financial loss.

With a background in journalism, Ritika Sharma has worked with many reputed media firms focusing on general news such as politics and crime. She joined The Coin Republic as a reporter for crypto, and found a great passion for cryptocurrency, Web3, NFTs and other digital assets. She spends a lot of time researching and delving deeper into these concepts around the clock, and is a strong advocate for women in STEM.


