
 Home
Home News
News
- 1 The LTC price is currently trading at $90.98 while seeing a change of 22.06% in 24-hour trading volume.
- 2 The LTC price has been observing a decline of 14.93% in the last 24 hours.
The LTC price is seeing an extremely bullish surge after gaining the buyer’s support near $75 around early May. Investors’ sentiments regarding the LTC token are bullish at present.
It is observing an increase of 15% within the last 7 days according to previous analysis though it is yet to attain its target.
The current value of the LTC coin is $90.98 and it has a Market Cap of $6.65B
Social Engagement and Dominance Comparison of LTC Token
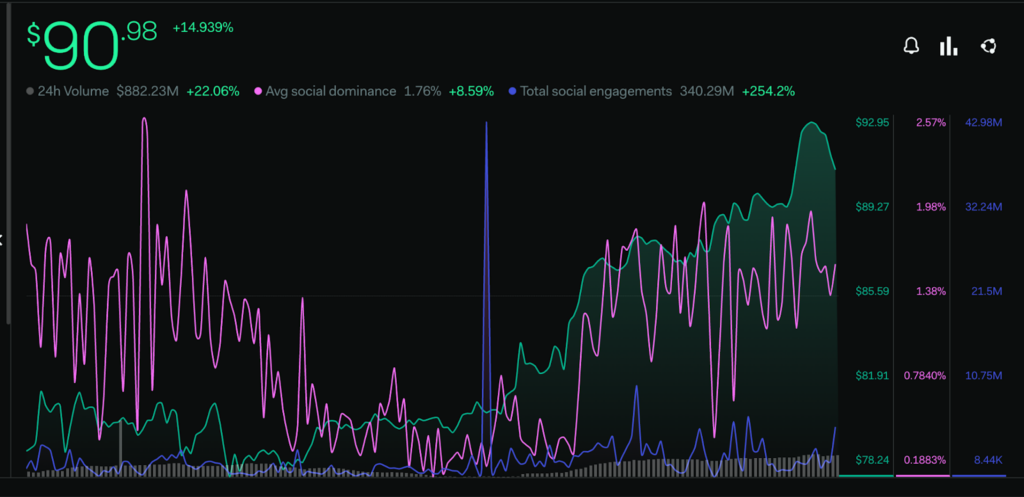
The Investor’s sentiments are currently bullish according to the price action and LunarCrush. The Bullish sentiment metrics are observing a slight increment within the past few days and Bearish sentiments have declined by 12%. The total Social Engagement levels have seen a significant surge of 254% in the last week which indicates that potential investors are gaining interest in the token across various community platforms.
Steady Increase in Price, TVL, and Active Users in the LTC Coin
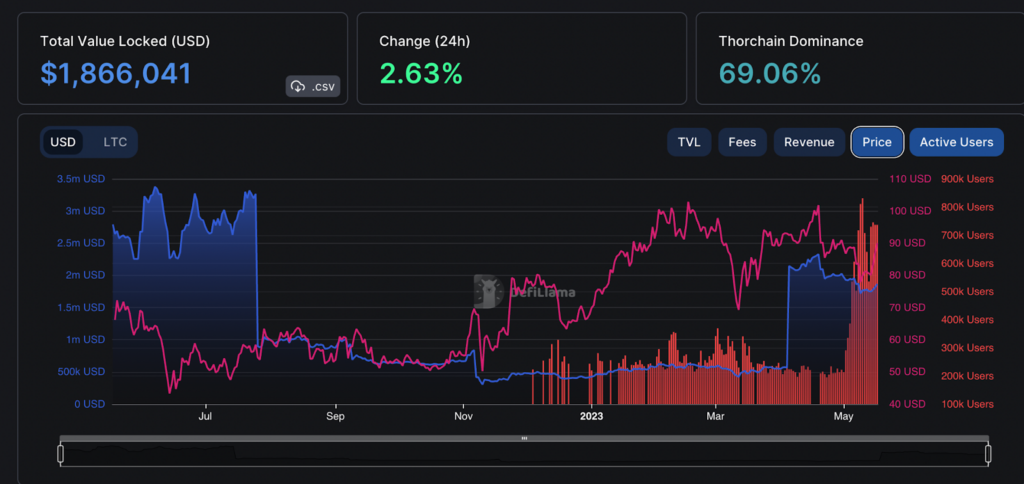
The TVL value of the token is presenting a recent increase in the investors’ confidence while the platform is also seeing a positive surge in active users within the past few months. Recently Lite coin gained 800K users after the coin broke its barrier near the 300k level. This recent increase in the number of users is creating a positive impact on the price of LTC.
The Total Value Locked of Litecoin has surged significantly since mid-April. Its current value is $1.866M with a change of 2.63% within the last 24 hours.
Technical Analysis (1-Day Timeframe )
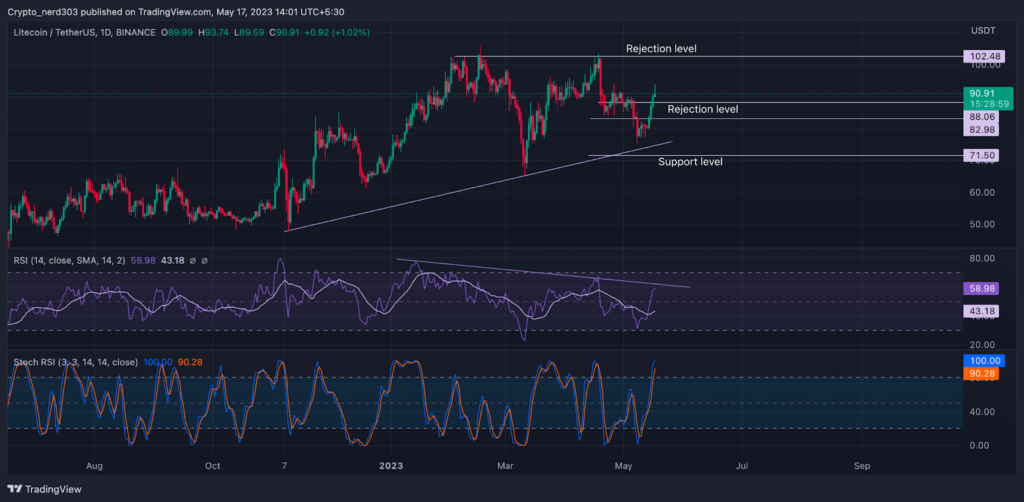
The RSI line is reaching its previous resistance level on a daily time frame. The present RSI value is 58.98 points and the 14 SMA is trading below it at around 43.18 points. The RSI line is making a lower high and low in contrast with the price action.
The stochastic RSI is also following the RSI. It may give a bearish crossover between the %K and %D lines in the near future. The current value of the %K line is 100.00 points and the %D line is 90.20 points.
Conclusion
The technical indicators are favoring the bulls at present. The price may see a further increase in the near future If it gains support from buyers near its recent support level. The Oscillators have reached their supply and they can take a bearish reversal within the recent days.
Technical levels –
Support –$71.0 and $82.0
Resistance – $102.48
Disclaimer
The views and opinions stated by the author, or any people named in this article, are for informational purposes only, and they do not establish financial, investment, or other advice. Investing in or trading crypto assets comes with a risk of financial loss.

Nancy J. Allen is a crypto enthusiast, with a major in macroeconomics and minor in business statistics. She believes that cryptocurrencies inspire people to be their own banks, and step aside from traditional monetary exchange systems. She is also intrigued by blockchain technology and its functioning. She frequently researches, and posts content on the top altcoins, their theoretical working principles and technical price predictions.


