
 Home
Home News
News
- 1 DOT price is currently trading at $5.43, seeing a change of -14% in 7 days of trading volume.
- 2 The price of DOT has been observing an increase of 0.93% in the last 24 hours.
The investors’ sentiments seem to be taking a bearish turn toward the DOT price. It recently saw a sudden 15% drop in price near early May. The price is currently consolidating within a narrow range on a smaller time frame. If the price makes an attempt to recapture the previous trend it may face severe resistance from the 100 and 200 EMA. Hence, the path of least resistance for the DOT price is pessimistic for buyers.
The oscillators are indicating that the price may continue to take a further decline in the near future. On a smaller time frame, the price has been taking constant resistance from the 100 EMA. Presently it is trading just below it on the demand zone near its previous resistance levels.
The current value of DOT is $5.43, It has a Market Cap of $6.45B.
Increase in Negative Sentiment and Social Engagement
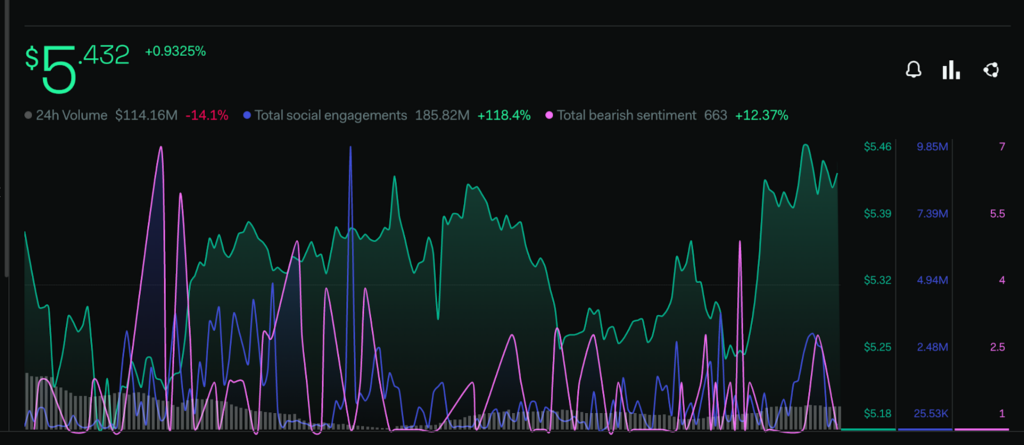
There is a slight increase in the bearish sentiments of the investors according to the LunarCrush. Total Bearish Sentiment metrics have surged by 12.37% within the last week whereas in comparison the bullish sentiment rate is seeing a slight decline.
The Total Social Engagement rate has increased by 118.4% indicating that the community is getting more engaged regarding the token across various media platforms. This indicates that potential buyers may start taking an interest in the token.
DOT price Consolidating Near Support Zone
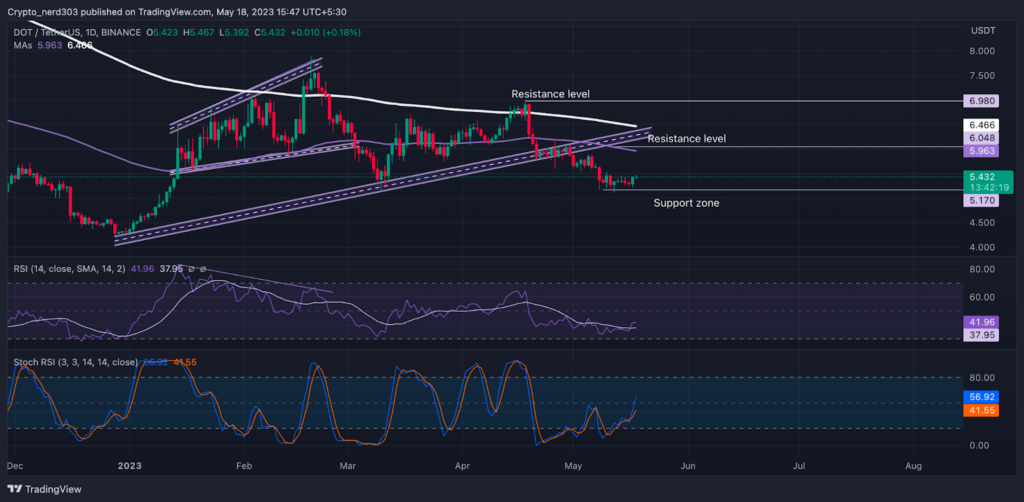
The DOT price is currently trading below the 100 and 200 EMA. The current support levels for the DOT price are around $5.100 and its major support level is at $4.500. The recent resistance point for the price of DOT is near $6.000 whereas its major resistance is at $7.000.
The RSI line is giving a positive crossover above 14 SMA. As of now, the RSI is suggesting that it might take a bullish turn on the daily timeframe. The value of the RSI line as of now is 41.96 points; the 14 SMA is providing support at 37.95 points.
The stochastic RSI recently took a bullish reversal. The stochastic RSI often provides more direct signals in comparison with RSI. At present it is taking a sharp turn towards the overbought levels. The %K line has intercepted the median line.
Conclusion
According to analysis, the DOT price is trading under a bear trend. It is currently attempting to take a retest though the 4Hr suggests that it may prove to be slightly challenging.
Technical levels –
Support – $4.400 and $5.100
Resistance – $0.6000 and $0.7000
Disclaimer
The views and opinions stated by the author, or any people named in this article, are for informational purposes only, and they do not establish financial, investment, or other advice. Investing in or trading crypto assets comes with a risk of financial loss.

Nancy J. Allen is a crypto enthusiast, with a major in macroeconomics and minor in business statistics. She believes that cryptocurrencies inspire people to be their own banks, and step aside from traditional monetary exchange systems. She is also intrigued by blockchain technology and its functioning. She frequently researches, and posts content on the top altcoins, their theoretical working principles and technical price predictions.


