
 Home
Home News
News
- 1 The AAVE price is currently trading at $65.19 near the demand zone.
- 2 The AAVE price has been observing an increase of 5.07% in the last 24 hours.
The AAVE price is currently trading under the seller’s significant presence. At present the majority of technical indicators are taking the bear’s favor. Both major key EMA and SMA levels are providing critical resistance to price. These indicators are often respected by many investors to measure the market. After making continuous efforts over the past few months to cross above the critical resistance levels the buyers have not been able to attain their target.
A Significant Increase in Social Engagement levels
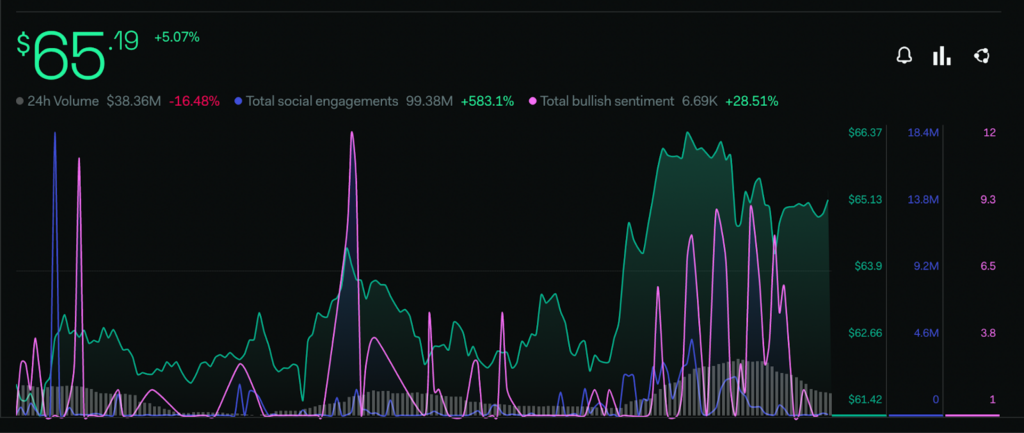
The investor’s sentiments regarding the Avalanche token are presently bullish.The Total bullish sentiment metrics provided by LunarCrush have surged by 28% within the last week despite the bears’ strong presence in price action. The Total Social engagement metrics are observing a critical rise of 583.1%.
A Surge Active Users and TVL of AAVE Token
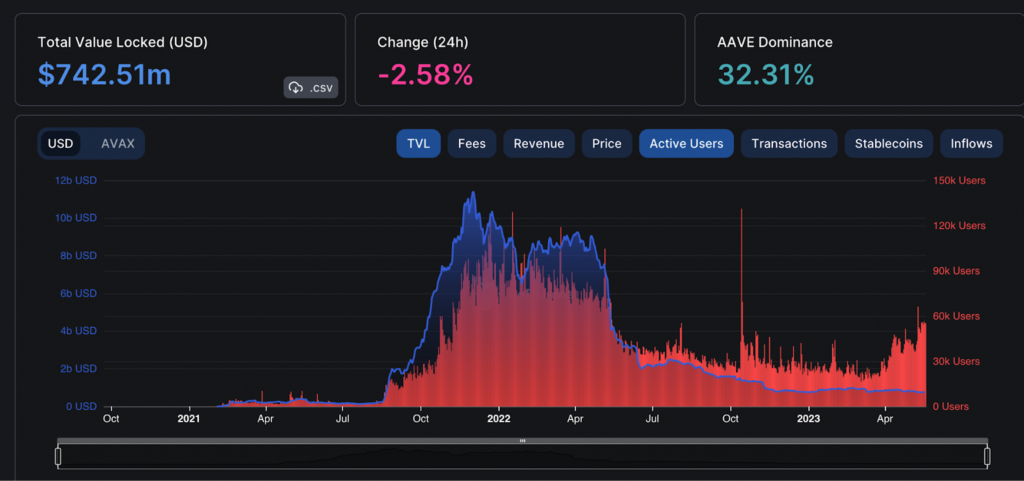
The TVL (Total Value Locked) is seeing a sharp decline in its value since last January. The decrease in TVL value represents the declining confidence of the buyers. The present TVL of AAVE is 742.51M, it is observing a change of -2.58% within the last 24 hours.
In comparison to TVL, the value of Active Users has surged slightly. After moving near the 30k users for the past few months it gave a breakout and reached 60K users near early May.
Technical Analysis ( 1 Day Timeframe )
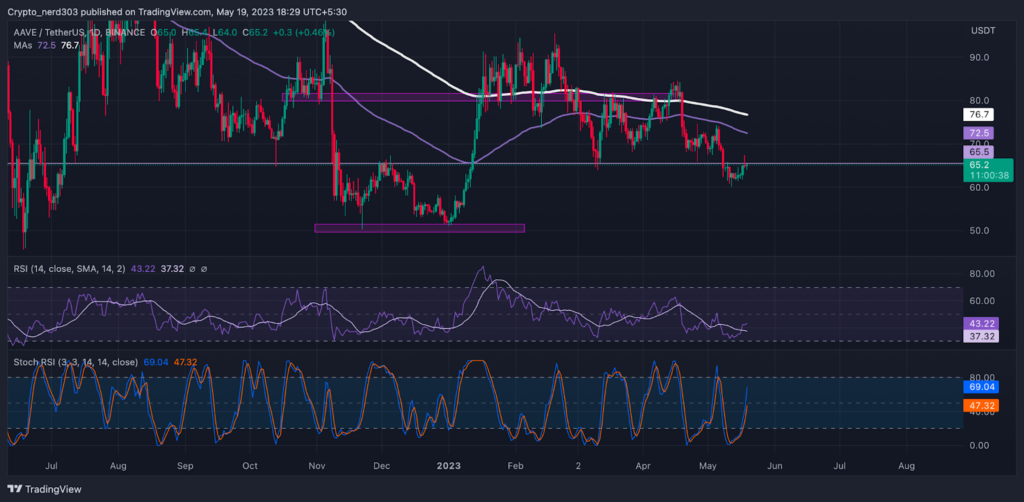
Presently, the RSI line is moving in a downtrend by making lower high and low patterns. The present RSI value is 43.22 and the value of 14 SMA is 37.32 points. The RSI line is suggesting that it may make another bearish move according to the previous movements.
In stochastic RSI, the %K line recently took a reversal from the demand zone and has already crossed above the median line, the %D line is following it closely. Presently the value of the Stochastic RSI is 69.04 points on the 1-Day chart.
Conclusion
As per the analysis, the oscillators are presently taking a bullish turn after trading in the oversold levels for the past few weeks. The price is observing a decline of 8% within the past 7 days It is estimated to see a further decline in its value if the buyers do not step in to support the AAVE token. The probability of a bullish reversal is not very prominent; the price is facing multiple resistance levels.
Technical levels –
Support – $60.00
Resistance – $80.00and $70.00
Disclaimer
The views and opinions stated by the author, or any people named in this article, are for informational purposes only, and they do not establish financial, investment, or other advice. Investing in or trading crypto assets comes with a risk of financial loss.

Andrew is a blockchain developer who developed his interest in cryptocurrencies while pursuing his post-graduation major in blockchain development. He is a keen observer of details and shares his passion for writing, along with coding. His backend knowledge about blockchain helps him give a unique perspective to his writing skills, and a reliable craft at explaining the concepts such as blockchain programming, languages and token minting. He also frequently shares technical details and performance indicators of ICOs and IDOs.


