
 Home
Home News
News
- 1 XMR’s price is currently trading at $151.3 with a decrease of 21% in the 24-hour trading volume.
- 2 XMR price recorded a decline of 0.25% in the last 24 hours.
Presently, XMR price is trading under a narrow convergence of key EMAs under a bearish correction. After making a double top pattern near $165.00 the price took a bearish turn, breaking below the 200 and 100 EMA with strength. Presently the price of XMR is trading under the firm control of the bears. The buyers are struggling to support the price near $150.00 however there is a strong presence of sellers in the price action.
Despite the recent bearish sentiments in the market, the overall trend for Monero price is bullish. The technical indicators present contrasting views. While the price is facing severe resistance from multiple key EMA and MA lines the Oscillators are trading near the demand zone. This suggests a bullish reversal, hence a few investors may prefer to remain on the sidelines.
XMR Price Under a Consolidation Above 200 EMA on the (1-Day Timeframe)
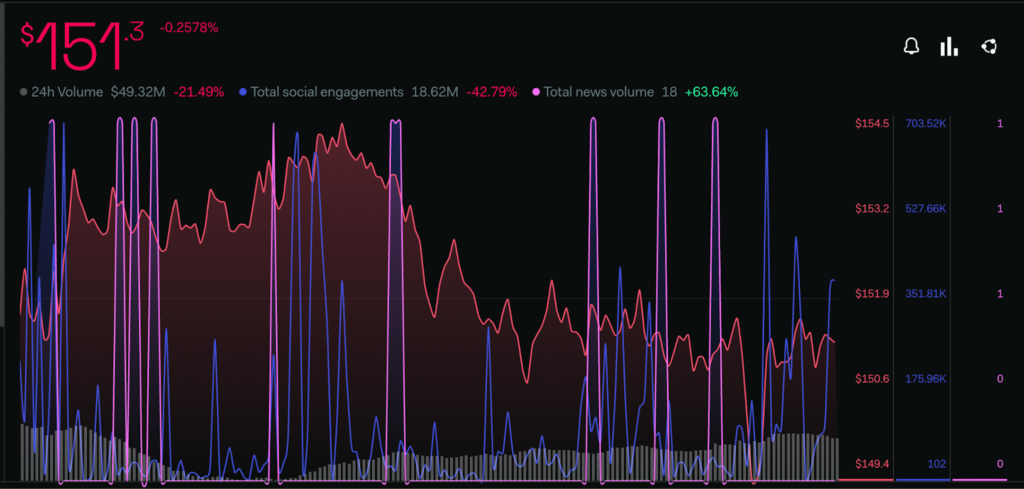
A sharp decrease in the bullish sentiment metrics of 49% has been observed within the last week. Though despite the decline in the majority of parameters the news volume is observing a sudden spike of 63.64%.
This indicates that the token is gaining media attention for the last few days.
Technical Analysis (1-Day Timeframe )
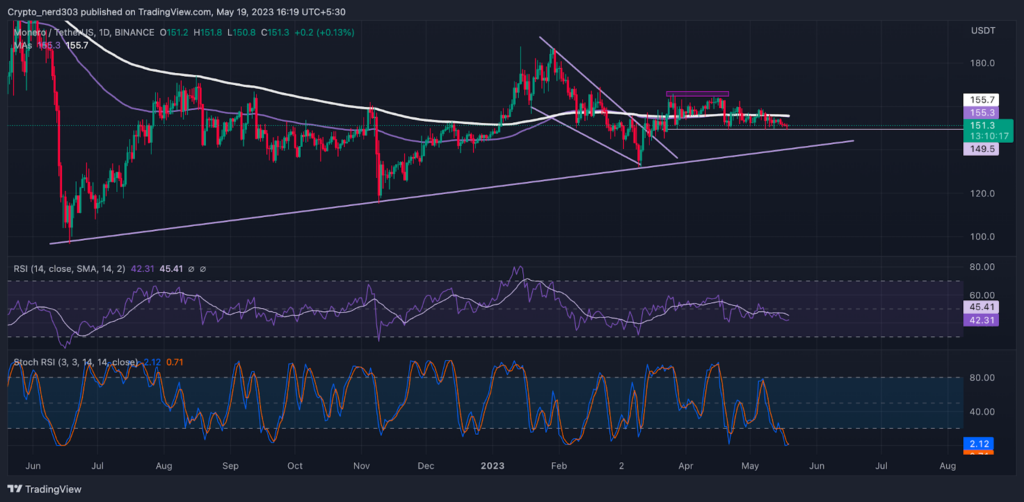
As of now, Monero’s price is trading just below the 200 EMA and 100 EMA. The price is currently facing significant selling pressure. Though the buyers are making an attempt to support the price near the current level most of the technical parameters are against them. If the price fails to gain buyers’ support it can see a decline of 10% within the next few days.
The RSI line is taking constant resistance from 14 SMA below the median line. As of now, the RSI is giving a bearish perspective. The present value of the RSI line is 42.31 points; the 14 SMA is providing rejection at 45.41 points.
The stochastic RSI is trading at the oversold level of 2.12 points. The %K line is suggesting that it may soon provide a positive crossover to the %D line.
Conclusion
According to the analysis, The Technical indicators suggest that the bears may remain in control of the price action for the upcoming days. XMR price is trading under major EMA and MA levels. The oscillators are trading in contrast with each other.
Technical levels –
Support –$149.5 and $130.00
Resistance – $160.0 and $165.0
Disclaimer
The views and opinions stated by the author, or any people named in this article, are for informational purposes only, and they do not establish financial, investment, or other advice. Investing in or trading crypto assets comes with a risk of financial loss.

Nancy J. Allen is a crypto enthusiast, with a major in macroeconomics and minor in business statistics. She believes that cryptocurrencies inspire people to be their own banks, and step aside from traditional monetary exchange systems. She is also intrigued by blockchain technology and its functioning. She frequently researches, and posts content on the top altcoins, their theoretical working principles and technical price predictions.


