
 Home
Home News
News
- 1 The QNT price is currently trading at $102.2 while seeing a change of 15% in 24-hour trading volume.
- 2 Quant is observing a decline of 5.03% in the last 7 days.
Recently, the QNT price saw a substantial decline in its price after it broke its bull trendline. The price is currently trading below all the major EMA and MA levels on the daily timeframe. The price is predicted to see a further decline within the next few days in the absence of buyers’ support from recent support levels. Presently the price is seeing a decline of 12% within the last 7 days.
A Prodigious Raise In The YouTube Volume of QNT Coin
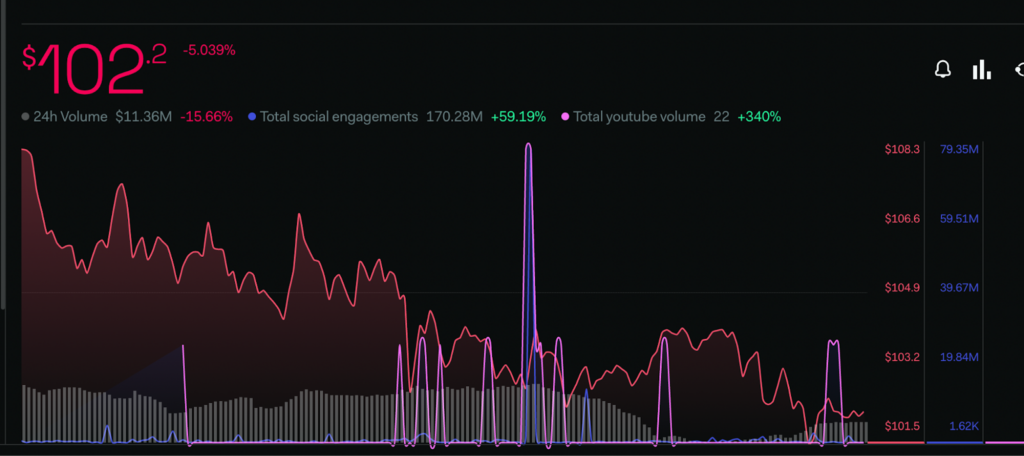
The investor’s sentiments are bearish at present according to the LuanrCrush. The total bullish sentiment metric is seeing a decline of 25% within the last 7 days though the Youtube volume is seeing a prodigious rise of 340%.
In the previous analysis, it was estimated that the price may see a further decline from $120, as it was taking resistance from the 200 EMA. The analysis was proven correct when after taking rejection from the key average QNT price saw a decline of 9% after making another attempt to recover its trend the price saw a surge in selling pressure and it took a downfall of 21% on the daily timeframe.
The majority of market sentiments are currently near the greed zone at 49 points, according to the greed and fear index, provided by the Alternative (dot) me platform. There is a decrease of 3 points within a short span of time where the sentiments were at 52 points.
The Bears are presently prominent in the price action, and they may remain in control of the future trend if the price fails to gain buyers support at recent support zone.
Technical Analysis of QNT Price (Daily Timeframe)
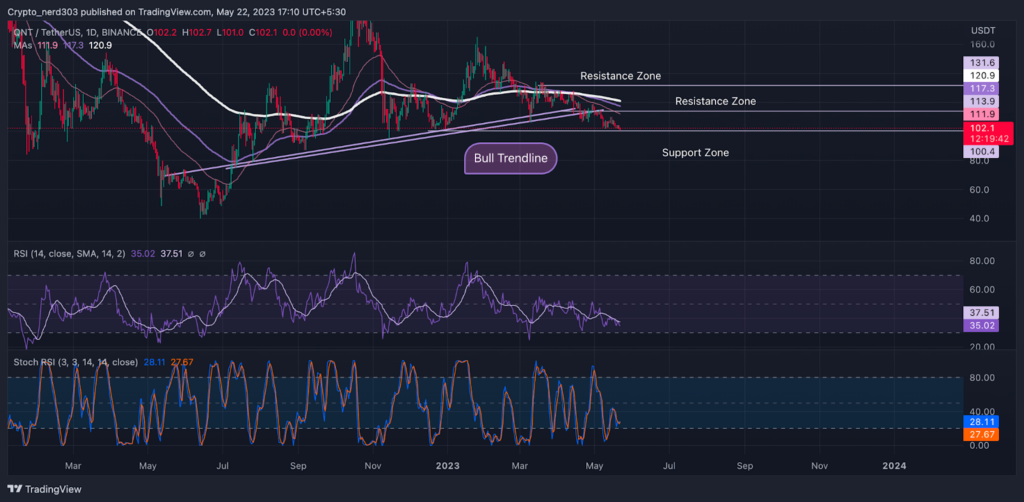
QNT is taking resistance from 50 EMA below 200 EMA. The current support level for the price is around $100 and its major support level is at $98. The resistance point for QNT is near $110 and its major resistance is at $116.
The RSI line has been moving above the 14 SMA, taking constant resistance from the line. The RSI line is currently moving around 35.02 points, while the 14 SMA is providing resistance at nearly 37.51 points.
Conclusion
As per the analysis, the Technical Indicators are currently trading in the bear’s support. The price is taking resistance from the 50 EMA; trading below the 100 and 200 key levels. The oscillators are taking resistance from the median line.
Technical levels
Support – $98 and $100
Resistance – $110 and $116
Disclaimer
The views and opinions stated by the author, or any people named in this article, are for informational purposes only, and they do not establish financial, investment, or other advice. Investing in or trading crypto assets comes with a risk of financial loss.

With a background in journalism, Ritika Sharma has worked with many reputed media firms focusing on general news such as politics and crime. She joined The Coin Republic as a reporter for crypto, and found a great passion for cryptocurrency, Web3, NFTs and other digital assets. She spends a lot of time researching and delving deeper into these concepts around the clock, and is a strong advocate for women in STEM.


