
 Home
Home News
News
- 1 The LTC price is currently trading at $85.32 while seeing a change of 65.31% in 24-hour trading volume.
- 2 The LTC price has been observing a decline of 1.26% in the last 24 hours.
Recently LTC price saw a substantial bullish surge of 22% after gaining support from bulls near $75 around early May. Though the price was not able to attain its target of $100 despite aggressive buyer support. Presently, It is trading near 200 MA observing a decline of 11% after facing swift rejection from $94.00.

The current value of the LTC coin is $90.98 and it has a Market Cap of $6.65B

Recent Increase in Bullish Sentiment of Investors
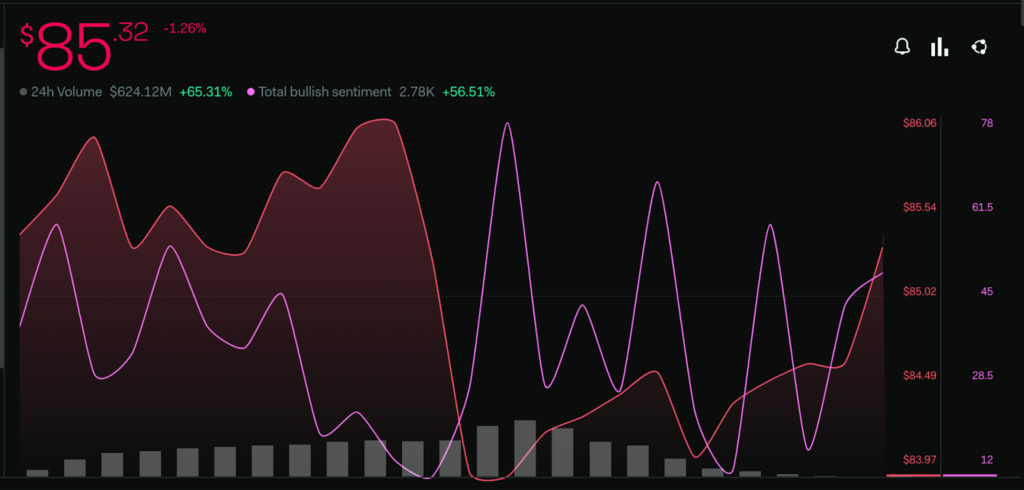
The sentiment metrics provided by LunarCrush suggest that there is a significant increase in the bullish sentiments of the buyers within the last few days. The total bullish sentiment rate has surged by 56.61% furthermore on the bigger timeframe the Youtube volume of the token has increased by 500% which signifies that the token is gaining investors’ attention on the YouTube platform.
Steady Increase in Price, TVL, and Active Users in the LTC Coin
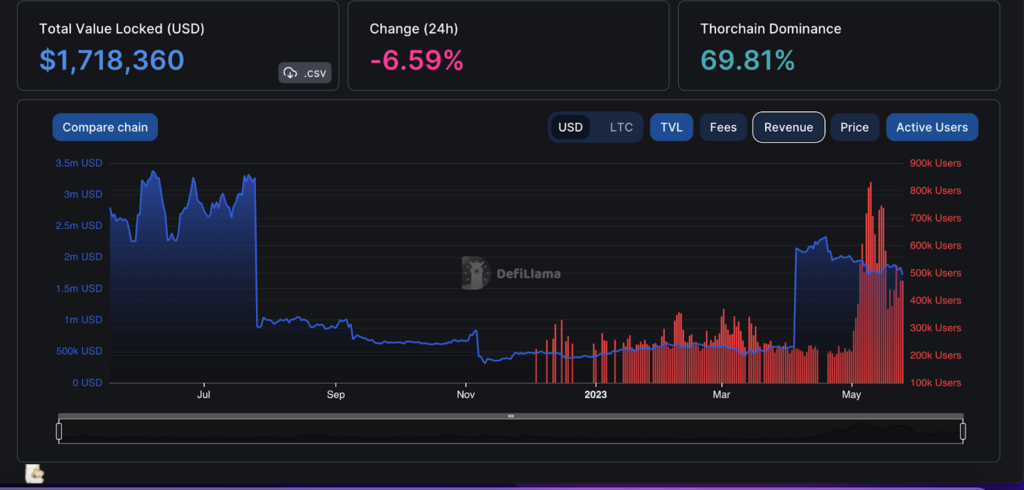
The TVL value of the token is observing a significant increase in its value near late April. There also seeing a positive surge in active users within the past few months. Recently Lite coin gained 800K users though there is a slight decline in it at present.
The Total Value Locked of Litecoin has surged significantly within the past few months. At present it is moving near 1,710M with a change of -6.59% within the last 24 hours.
Fees and Revenue of LTC Token
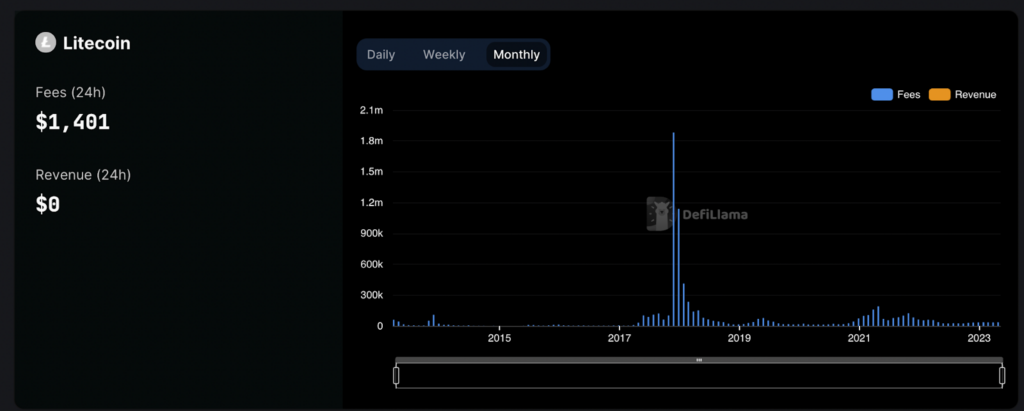
According to the illustration above following a slight decline in the previous year, the fees obtained by Litecoin are stagnant despite the recent increase in the TVL and Active User value. The total Fees generated by Litecoin within the last 24 hours is $1,401.
Technical Analysis (1-Day Timeframe )
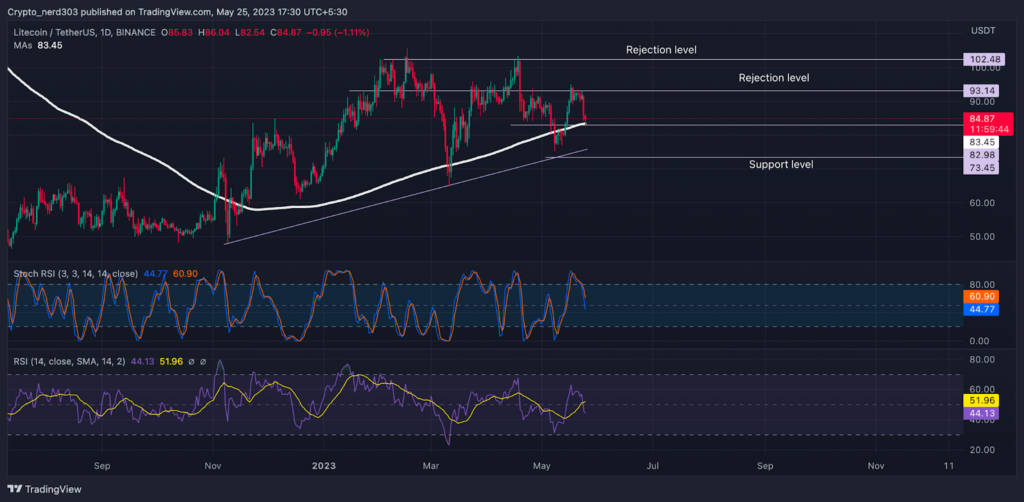
The RSI line is taking a negative reversal from the previous resistance level; crossing below the 14 SMA. The present RSI value is 44.13 points and the 14 SMA is trading below it at around 51.96 points.
The stochastic RSI is mimicking the RSI closely. It recently took a bearish turn from the oversold level and may soon give a bearish crossover to the median line. The current value of the %K line is 44.77 points and the %D line is 60.90 points.
Conclusion
Analyzing previous analysis it can be observed that the price of LTC has not been respecting its 200 EMA in the preference of the trendline. Hence it is estimated that the value of Litecoin may observe a slight further decline before finding buyers’ support.
Technical levels –
Support –$71.0 and $82.0
Resistance – $102.48
Disclaimer
The views and opinions stated by the author, or any people named in this article, are for informational purposes only, and they do not establish financial, investment, or other advice. Investing in or trading crypto assets comes with a risk of financial loss.

With a background in journalism, Ritika Sharma has worked with many reputed media firms focusing on general news such as politics and crime. She joined The Coin Republic as a reporter for crypto, and found a great passion for cryptocurrency, Web3, NFTs and other digital assets. She spends a lot of time researching and delving deeper into these concepts around the clock, and is a strong advocate for women in STEM.


