
 Home
Home News
News
- 1 BCH’s price is currently at $115.
- 2 Bitcoin Cash recorded an 8% downfall in 24-hour trading volume.
- 3 BCH is down by 0.72% in the last 24 hours.
BCH price is currently attempting a positive reversal from the support zone of the range on the daily timeframe. It is making a bullish candlestick pattern which suggests that the investor’s sentiments regarding the future trend are taking a positive turn despite the previous major selling pressure.

Presently, the buyers are defending the support zone fiercely. Though their attempts may not yield the desired result if they fail to support the price near the base of the range zone.

The present value of BCH is $115. It has a market capitalization of around $2.23 Billion seeing a slight surge within the past few weeks.
The Negative Turn Of Buyer’s Sentiments
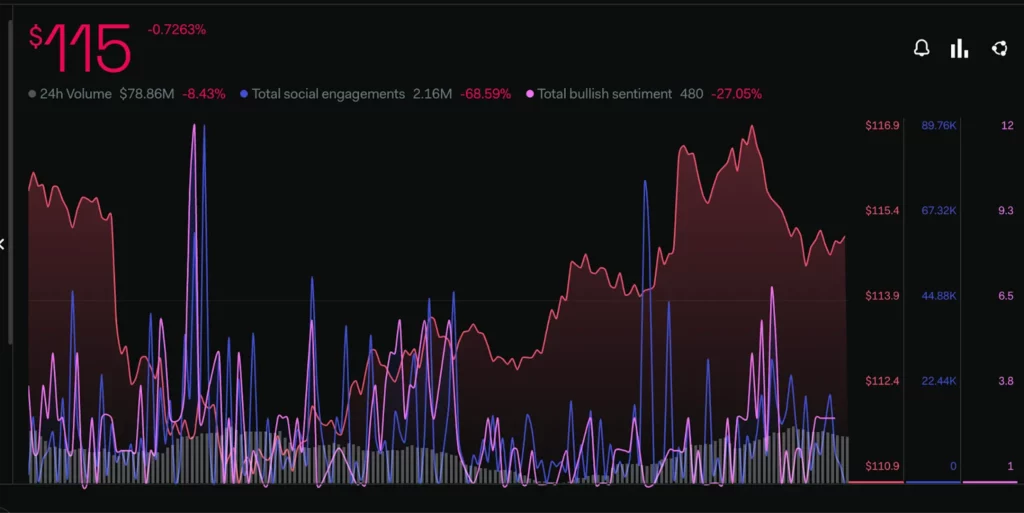
Investor sentiment is presently seeing a decrease in total bullishness suggesting that the buyers are projecting negative sentiments regarding the token across various social media platforms. Total bearish sentiment metrics provided by LunarCrush are seeing a decline of 27.05% whereas Total Social Media volume fell by 68.59% within the past week.
The majority of technical indicators are giving positive signals regarding the upcoming change in the direction of the market. The price may face severe resistance from the current resistance zone before it attains its target. Per the previous analysis, it can be estimated that the price has been facing constant rejection around the 200 EMA.
Technical Analysis (1 Day Timeframe )
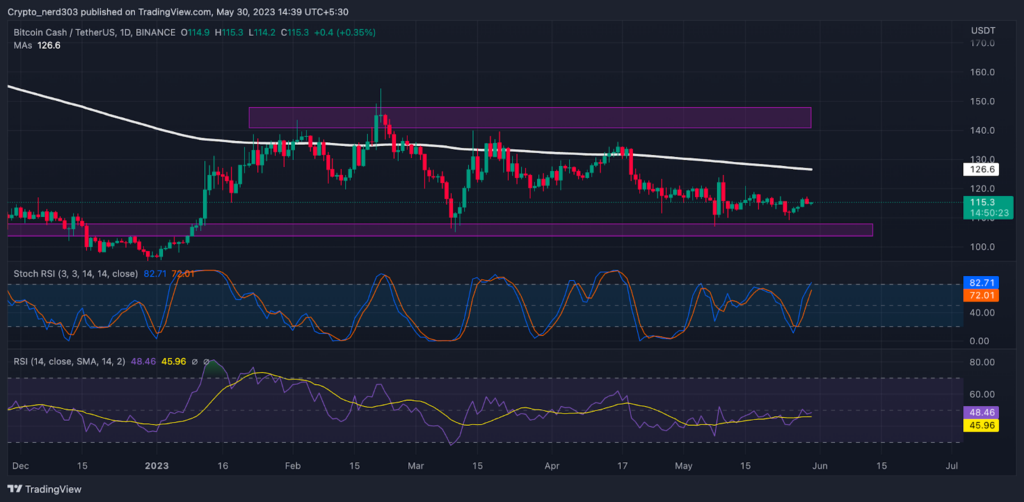
BCH price is attempting to take a bullish reversal from the demand zone despite strong selling pressure in the market. The price attempted a bullish rebound from the base level of $100.0.
The RSI line has been making continuous efforts to breach the resistance from the median line without success. The current value of RSI is 48.46 points, whereas the 14 SMA is providing support to it at 45.96 points.
The stochastic RSI s is trading near the oversold levels around its previous resistance zone. The value of the stochastic RSI is 72.01 points. The %K line may soon give a negative interception to the %D and the median line.
Conclusion
As per the analysis, the price of BCH is currently projecting bullish indications regarding the future trend. However, the price is facing critical resistance from the 200 EMA. Observing the historical price action the price has been respecting the resistance zone for the past few months.
Technical levels –
Support – $100.0
Resistance – $130.0 and $140.0
Disclaimer
The views and opinions stated by the author, or any people named in this article, are for informational purposes only, and they do not establish financial, investment, or other advice. Investing in or trading crypto assets comes with a risk of financial.

With a background in journalism, Ritika Sharma has worked with many reputed media firms focusing on general news such as politics and crime. She joined The Coin Republic as a reporter for crypto, and found a great passion for cryptocurrency, Web3, NFTs and other digital assets. She spends a lot of time researching and delving deeper into these concepts around the clock, and is a strong advocate for women in STEM.


