
 Home
Home News
News
- 1 NEAR is currently trading at $1.645 on the daily time frame.
- 2 The NEAR price recorded a decline of 1.56% in the last 24 hours.
NEAR price is making a bullish W pattern on the daily timeframe. The price of Near has been facing severe resistance from the 200 EMA and all the key faster-moving 20,50,100 averages are trading below it. Presently, the buyers are attempting a breakout of the bear’s hold. It may require a substantial effort from the buyer’s side in order to make a positive breakout above its previous resistance level.
Analyzing the historical price action, it can be estimated that the investors have been respecting the W pattern frequently which strengthens the probability of a bullish recovery.
A Spike in Negative Sentiments
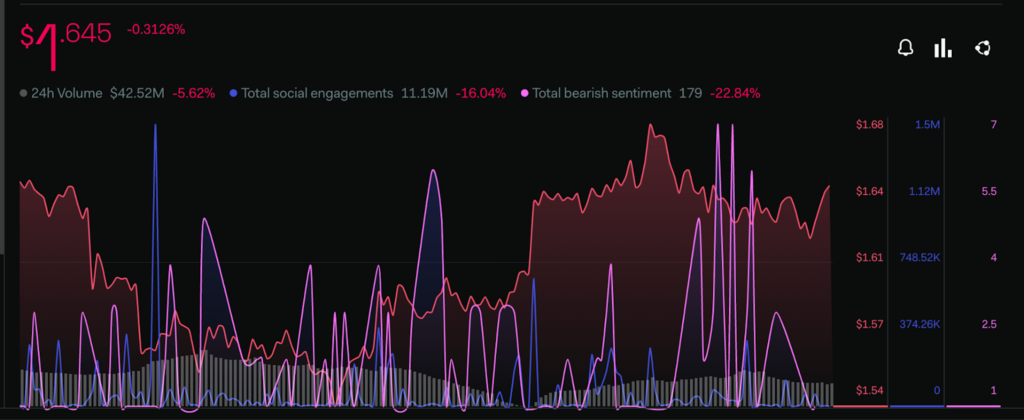
Investors are projecting an increase in negative sentiments toward the buyers regarding the Near Token. Total bearish sentiment metrics provided by LunarCrush saw a decline of 22.84% whereas Total Social Media volume fell by 16.04% within the past week as per the metrics provided by LunarCrush.
The majority of parameters in the LunarCrush platform are exhibiting a negative decline in the metrics. This suggests that the buyers are not very optimistic regarding the token at present.
Technical Analysis (1 Day Timeframe )
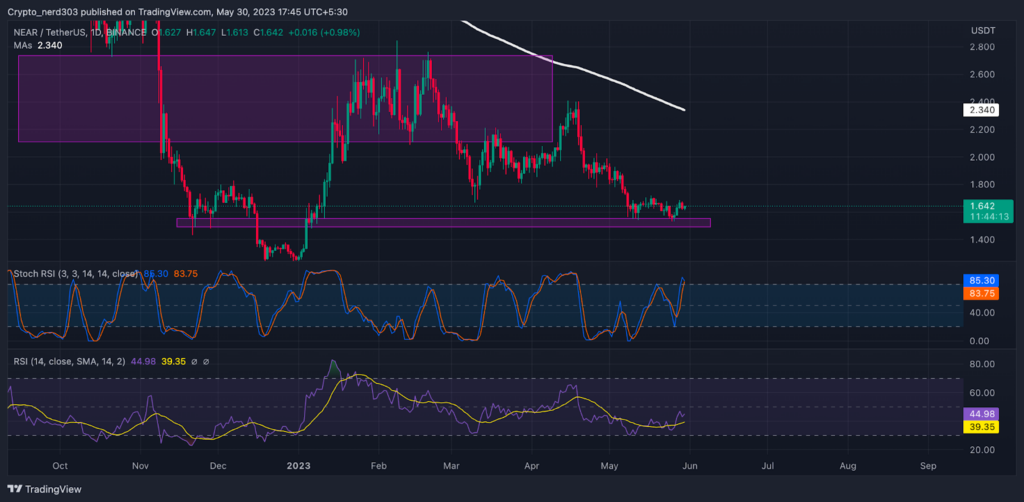
NEAR price is making a double bottom pattern near the support zone on the daily timeframe. At present, the support level for the NEAR token is around $1.500 whereas the current resistance point for the price of NEAR is near $1.600 and its critical resistance is at $2.000.
The RSI line has been trading below the median line near the oversold level for the past few weeks and failed to breach above 14 SMA. The RSI line is making lower highs and lower lows. Since last November, it is taking a retest from 14 SMA. The value of the RSI line as of now is 44.98 points, while the 14 SMA is making a barrier at 39.35 points.
The Stochastic RSI is trending near the overbought level of around 35.80 points. The %K line indicates that it may soon give a negative cross down to the %D line.
Conclusion
According to the analysis, the oscillators stochastic RSI and RSI are presently trading against each other. NEAR price is making a W pattern which hints at a bullish reversal from the current level.
Technical levels –
Support –$1.400
Resistance – $2.000
Disclaimer
The views and opinions stated by the author, or any people named in this article, are for informational purposes only, and they do not establish financial, investment, or other advice. Investing in or trading crypto assets comes with a risk of financial loss.

Nancy J. Allen is a crypto enthusiast, with a major in macroeconomics and minor in business statistics. She believes that cryptocurrencies inspire people to be their own banks, and step aside from traditional monetary exchange systems. She is also intrigued by blockchain technology and its functioning. She frequently researches, and posts content on the top altcoins, their theoretical working principles and technical price predictions.


