
 Home
Home News
News
- 1 The THETA price is trading at $0.854; seeing a change of 9,14% in 24-hour trading volume.
- 2 The THETA token has been seeing a slight increase in price of 1.84% in the last 24 hours.
The price of theta is presently observing a severe decline in its value on the daily timeframe. It is currently trading near an important support level below the key EMA’s. Though despite the recent bearish sentiment among the buyers it is making a positive reversal pattern. The price is making a bullish morning star candlestick pattern often observed before a bullish move. If the price gains buyers support from current levels it can make a 14% rally within the next few weeks.
The technical indicators are currently presenting contrasting viewpoints. Where on one side the EMA and MA levels are providing severe resistance to the price the Oscillators are trading near the demand zone indicating a bullish reversal.
The current value of the 1 INCH token is $0.854 and it has a market cap of $853.42 Million.
THETA Price is Trending Within a Descending Consolidation Channel
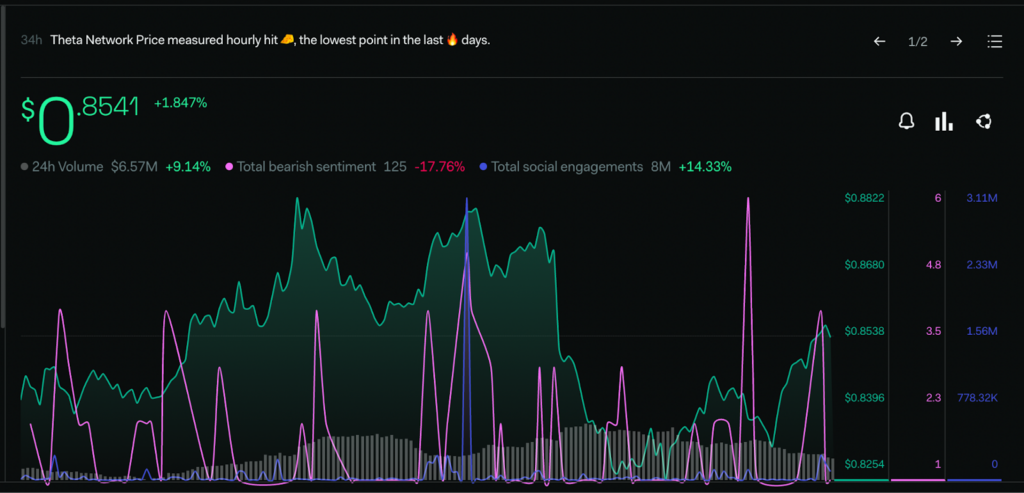
The investor’s sentiments regarding the THETA price are seeing a slight decline. Total Bearish sentiments metrics fell by 17.76% within the past week though there is a positive surge in the total social engagement level of 14.33% which indicates that the community is active regarding the THETA coin.
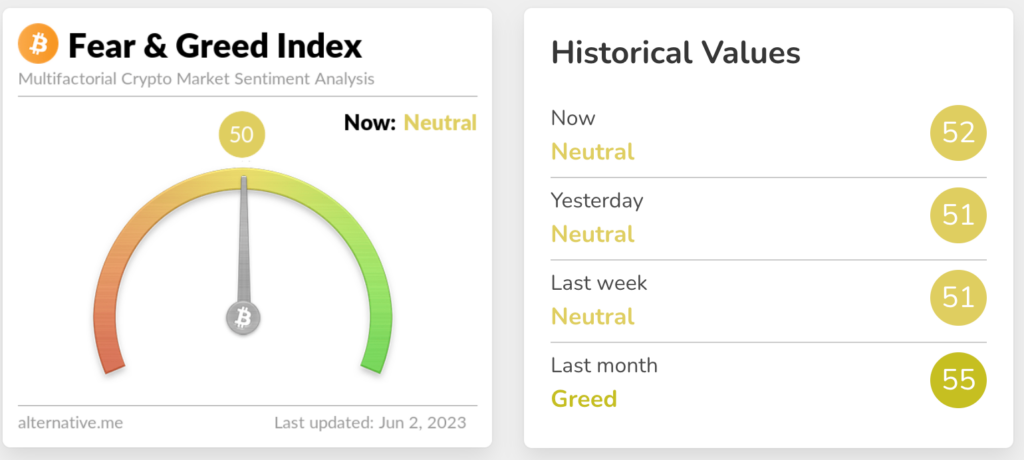
The overall market sentiments are trading near neutral levels at 50 points. The sentiment index is observing a decline of 5 points since the last month when the market was trading at around 55 points, As per the greed and fear index provided by the Alternative(dot)me platform.
Technical Analysis of the THETA Price
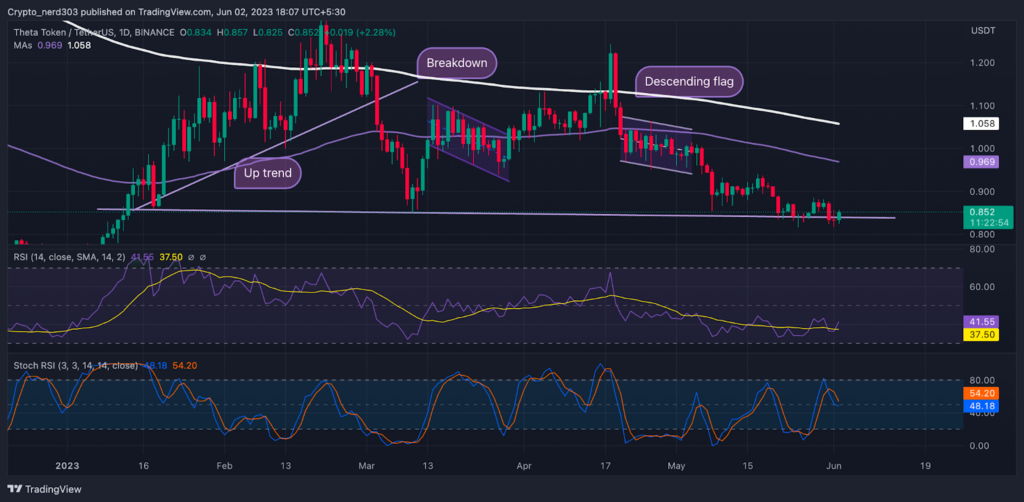
The RSI is at the present moment consolidating near below the median line with the price in the oversold level. The RSI line is moving around 41.55, while the 14 SMA is around point 37.50 points near the median line. The RSI line is predicted to see an increase in its value if it breaches the 50 RSI points.
The Stochastic RSI is indicating a positive appreciation from the median level. The %K line is in the initial stage of a positive interception. The current value of stochastic RSI is 48.18 points.
Conclusion
Presently the price of THETA is trading near the demand zone on the 1-day chart. If it gains positive support from the investors the price may make a bullish move in the near future.
Technical levels –
Support -$0.800
Resistance – $1.000
Disclaimer
The views and opinions stated by the author, or any people named in this article, are for informational purposes only, and they do not establish financial, investment, or other advice. Investing in or trading crypto assets comes with a risk of financial loss.

Andrew is a blockchain developer who developed his interest in cryptocurrencies while pursuing his post-graduation major in blockchain development. He is a keen observer of details and shares his passion for writing, along with coding. His backend knowledge about blockchain helps him give a unique perspective to his writing skills, and a reliable craft at explaining the concepts such as blockchain programming, languages and token minting. He also frequently shares technical details and performance indicators of ICOs and IDOs.


