
 Home
Home News
News
- 1 IOTA/USDT is currently trading at $0.1817 while seeing a significant change in the total 24 hours of 26.35%.
- 2 IOTA’s price is seeing a bearish decline.
The price of IOTA recently saw a sudden surge in selling pressure within the previous few days in accordance with the estimation in the previous price prediction. It is trading near the recent support level on the 1-day chart. At present, the price of IOTA requires significant support from the buyers to make a bullish comeback and gain prominence in the market.
The price recently gave a bearish breakout; making a double-top pattern in early June with an engulfing red candle after being overwhelmed by the sellers. Its current resistance level is $0.2200 (press time).
As was suggested in the previous price prediction, if the sellers succeed in overpowering the buyers from current levels, it may see a downturn. The bears were successful in seizing command over the market back from the bulls.
The price of IOTA attained its predicted target within a relatively short period of time. As of now, it has declined by 16% over the last 42 hours on the daily time frame.
IOTA’s price has a total market cap of $503.05 Million, and its current Alt rank is 443rd.
Sharp Appreciation in Total 24-Hour Trading Volume
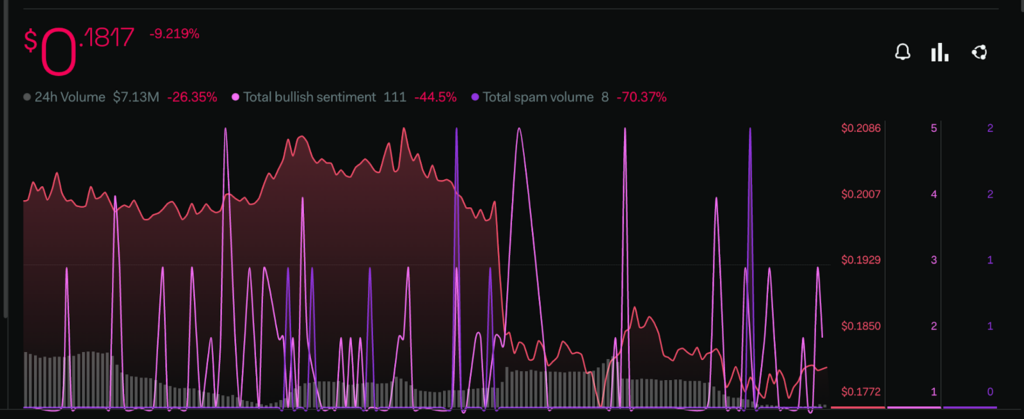
Investor sentiments project a fall in the bullishness regarding IOTA token. The total bullish sentiment metric is seeing a decrease of 44.5%.
There is an increase of 26.35% in the 24-hour trading volume which indicates that the buyers and sellers are participating actively in the trading activity, according to the Lunar Crush platform.
Technical Analysis (On 1 Day Time frame)
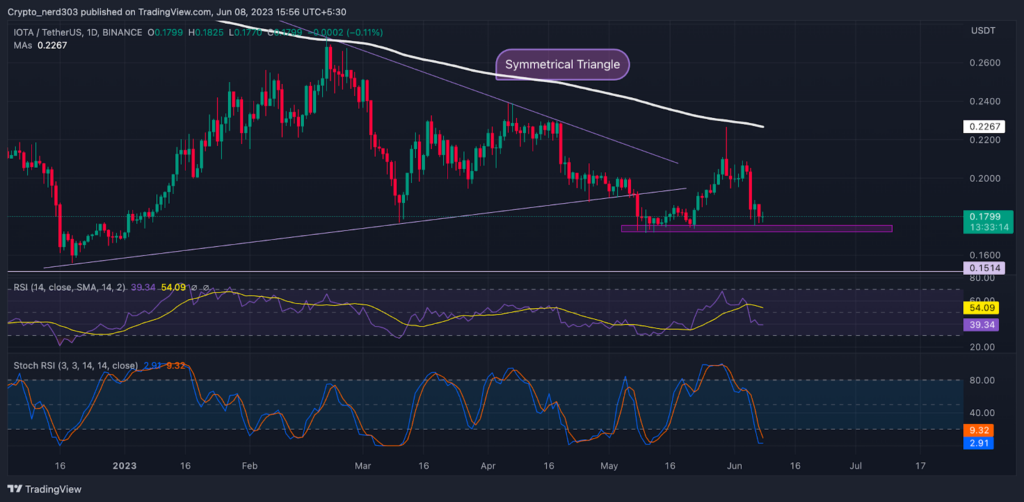
Presently, the price is making a double-top pattern taking rejection from the 200 EMA. IOTA price is trading below all the key EMA levels (20,-50,-100,-200 EMA).
The RSI line is following the price action closely, which signifies its strength. Presently, it is giving a hostile interception to the %D line. The current RSI value is 39.34 points while the 14 SMA is trading just above it at 54.09 points.
The stochastic RSI might take a positive reversal after reaching an oversold level. The %K line indicates that it may soon give the median line a bearish interception, with the current value of the stochastic RSI at 2.91 points.
Conclusion
According to the analysis, IOTA’s price requires significant support from the buyers to make a bullish comeback and gain prominence in the market.
Technical levels –
Support – $0.1700
Resistance – $0.2000
Disclaimer
The views and opinions stated by the author, or any people named in this article, are for informational purposes only, and they do not establish financial, investment, or other advice. Investing in or trading crypto assets comes with a risk of financial loss.

Andrew is a blockchain developer who developed his interest in cryptocurrencies while pursuing his post-graduation major in blockchain development. He is a keen observer of details and shares his passion for writing, along with coding. His backend knowledge about blockchain helps him give a unique perspective to his writing skills, and a reliable craft at explaining the concepts such as blockchain programming, languages and token minting. He also frequently shares technical details and performance indicators of ICOs and IDOs.


