
 Home
Home News
News

- 1 MINA’s price is currently trading at $0.502 with a change of 21.73% in the 7-day trading volume.
- 2 MINA price is down by 7.44% in the last week.
- 3 The price of MINA indicating towards a slight possibility of a bullish reversal in the near future.
Recently, Mina’s price made a negative breakdown through the descending channel. The price of MINA is presently trading near the support zone. Though the price action indicates that there is a significant presence of sellers in the market who maintain a firm grip on the price. It is moving below the crucial EMA levels which may prove to be challenging for the buyers in order to make a breakout.
The RSI and stochastic RSI are supporting the bulls on the daily timeframe. The oscillators are trading near the demand levels which suggests that the price is currently underbought. The value of MINA is currently near the demand level.

MINA Price May Take a Bullish Reversal
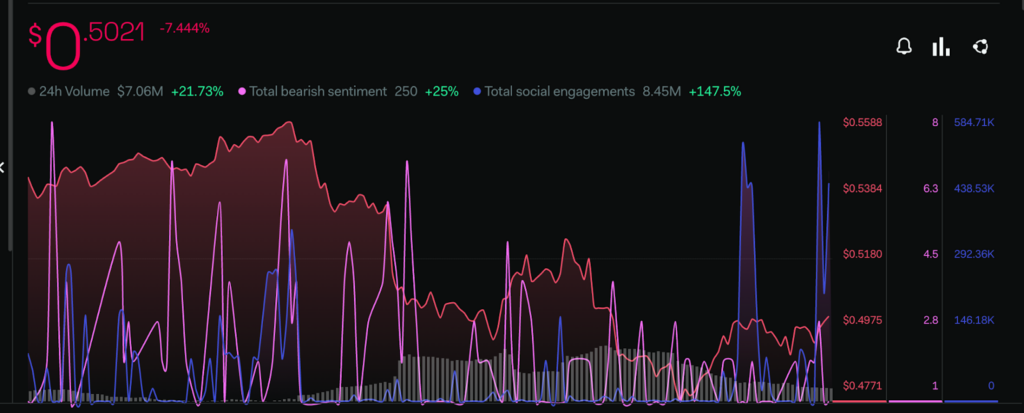
Investor sentiments are bearish at present according to the LuanrCrush. The total bearish sentiment of the buyers has increased by 25% within the last 7 days whereas the total social engagement volume is seeing a prodigious rise of 147.5%.
These metrics indicate that the buyers are getting less confident regarding the future value of the token. There is a positive increment in the total social engagement level which indicates that the community is getting more active regarding the token across various social media platforms.
Technical Analysis (1-Day Timeframe )
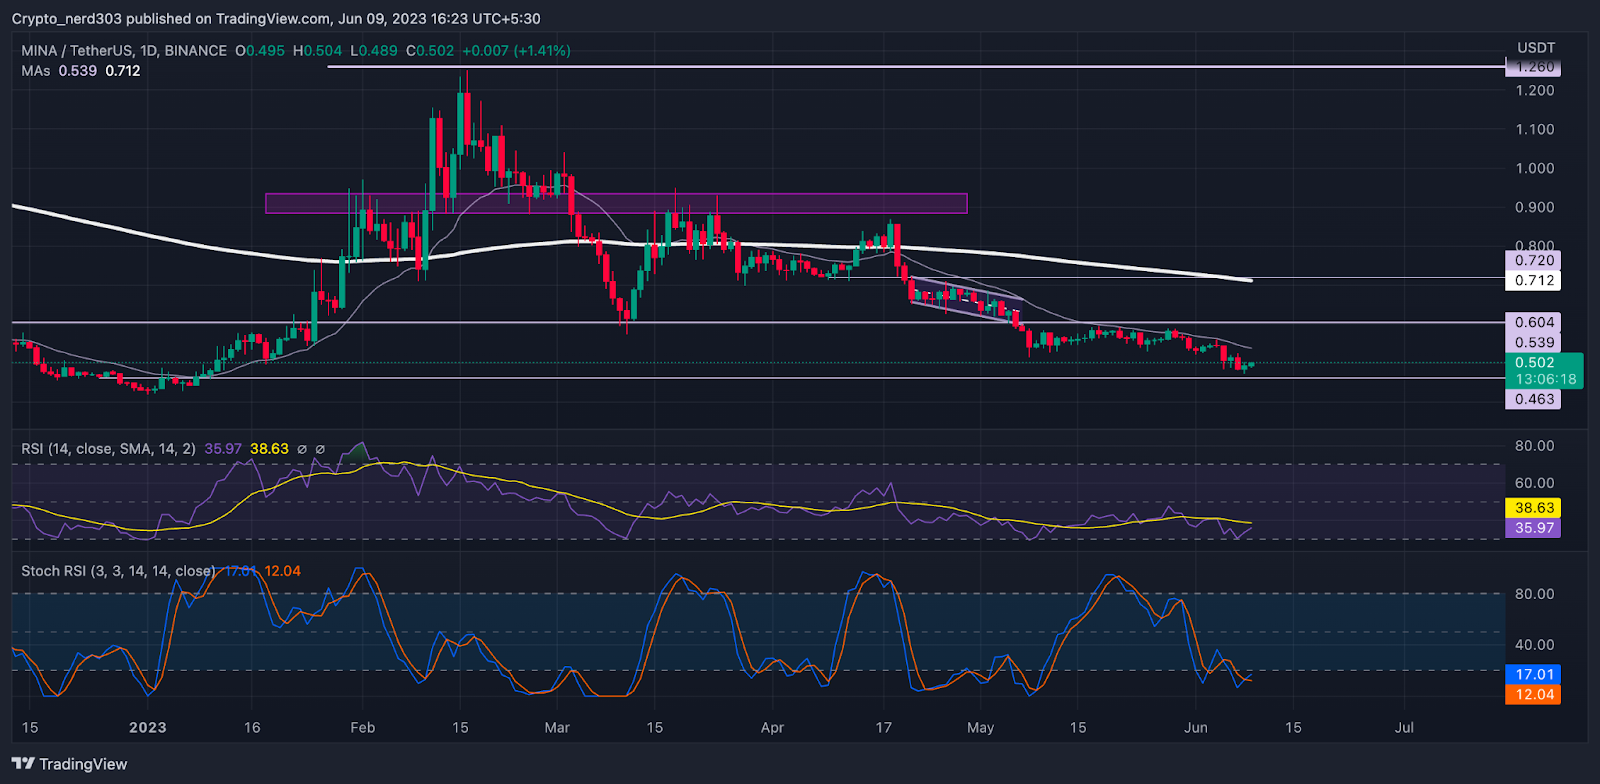
The Major key EMA lines are taking divergence after making a convergence around late April. The price has been making consistent resistance from 20 EMA on the daily timeframe. The price of MINA will require fierce from the buyers to recover its previous value.
The key -20,-50,-100 and -200 EMA levels are moving in descending order providing resistance to the price.
The RSI line is presently taking resistance from the 14 SMA on a daily time frame. The current RSI value is 35.97 points which is giving resistance to the 14 SMA line around 38.63 points. The RSI line may take another bearish correction before crossing above its resistance zone.
The stochastic RSI line is currently making a double-bottom pattern near the extreme oversold level. The %K and %D lines are providing a bullish interception above 30 points. At present, the value of stochastic RSI is trading around 17.01 points.
Conclusion
According to the analysis, the historical price action of MINA is suggesting that the token can make an attempt to make a trend reversal though the majority of the EMA levels provide grave resistance to it. The oscillators are in the bull’s favor.
Technical levels –
Support $0.450 and $0.400
Resistance – $0.600 and $0.700
Disclaimer
The views and opinions stated by the author, or any people named in this article, are for informational purposes only, and they do not establish financial, investment, or other advice. Investing in or trading crypto assets comes with a risk of financial loss.

Andrew is a blockchain developer who developed his interest in cryptocurrencies while pursuing his post-graduation major in blockchain development. He is a keen observer of details and shares his passion for writing, along with coding. His backend knowledge about blockchain helps him give a unique perspective to his writing skills, and a reliable craft at explaining the concepts such as blockchain programming, languages and token minting. He also frequently shares technical details and performance indicators of ICOs and IDOs.


