
 Home
Home News
News
- 1 The current price of ZEC is $28.96 with a change in 24-hour trading volume of -1.23%.
- 2 ZEC price is making a Doji Pattern
Recently, the ZEC price observed a significant decline in its value. After facing rejection from its trendline, the price fell by 32%. The price was around $35 last November; the price made multiple attempts to breach its 200 EMA resistance without success. Presently, it is moving near the demand zone making a bullish doji pattern and if the price makes another green candle it will make a bullish morning candlestick pattern.
The oscillators are projecting a bullish outlook at present, stochastic and RSI lines are steadily reaching their nearest support zone on the daily timeframe. As they both are moving near the demand zone there is a strong probability of a negative reversal.

The current price of ZEC is $28.96 with a change in 24-hour trading volume of -1.23%. Zcash is down 9.79% in the last 24 hours.
ZEC Price Gearing up for a Rally
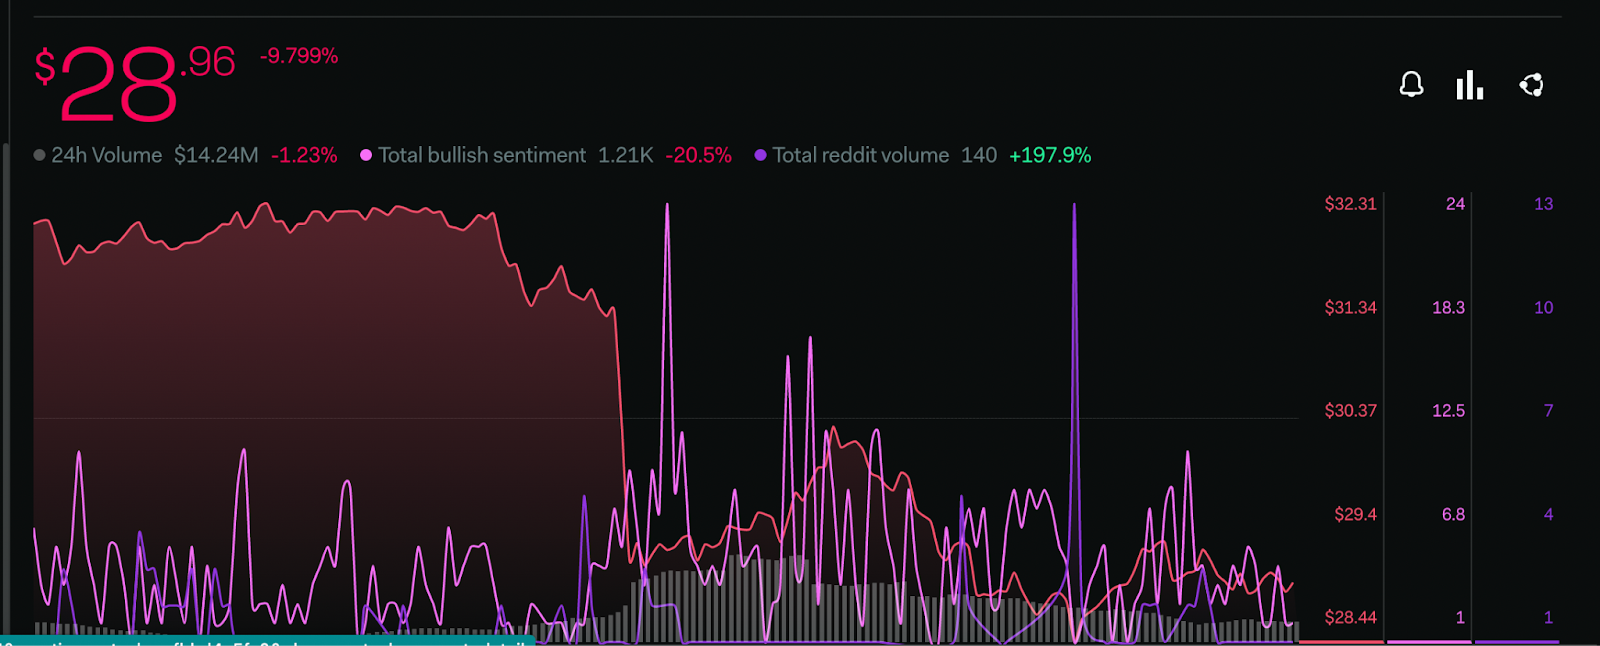
Investors are expressing negative sentiments regarding the ZCash token, there is an of 43.68% in the total bearish views of the buyers as per the metrics provided by LunarCrush.
There has been a significant escalation in the Reddit volume of the token of 197.9%. Suggesting the community is getting more active which indicates that there is an increase in the interest of potential buyers.
Technical Analysis (1 Day Timeframe )

Zcash is currently in a downtrend trading below 200 and other faster moving EMA. The bullish Doji candlestick pattern suggests that the price may attempt to make a recovery before continuing the downtrend.
The ZEC price is taking support from the price of $27.0, its next support level is around the price of $24.00. Its nearest target is 15% above the current price around the level of $36.00, whereas the main resistance for the ZEC price is 45% above the present price at a level of $40.00.
The RSI line is attempting a reversal from the demand level below the median line around point 33.89. The positive RSI curve is indicating that the RSI line might start moving toward the overbought zone. The 14 SMA is near the demand level at
40.97 points providing support to the RSI line.
Conclusion
ZEC price is currently trading below major key averages. The oscillators are projecting a bullish perspective. It can be estimated that the bears currently hold prominence in the market.
Technical levels –
Support – $24.00 and $27.0
Resistance – $36.00 and $40.00
Disclaimer
The views and opinions stated by the author, or any people named in this article, are for informational purposes only and do not establish financial, investment, or other advice. Investing in or trading crypto assets comes with a risk of financial loss.

Andrew is a blockchain developer who developed his interest in cryptocurrencies while pursuing his post-graduation major in blockchain development. He is a keen observer of details and shares his passion for writing, along with coding. His backend knowledge about blockchain helps him give a unique perspective to his writing skills, and a reliable craft at explaining the concepts such as blockchain programming, languages and token minting. He also frequently shares technical details and performance indicators of ICOs and IDOs.


