
 Home
Home News
News
- 1 FTM/USDT is currently trading at $0.2719 while seeing a change in 24 hours of 1.36%.
- 2 The market cap of the FTM coin is $ 760.39 Million and it has a circulating supply of 2.8 Billion.
FTM price recently gave a negative breakout through some crucial support levels where the majority of technical indicators were giving bullish indications. The price action might have been discouraging for some investors as the price did make a 4-star setup where it was taking support from the 200 EMA.
The price was also making a bullish ascending flag pattern whereas the RSI and stochastic oscillators were moving around undersold levels indicating that the token was undervalued. Despite having the backing of a majority of technical indicators the Bulls could not defend the price.
Sharp Decline in Revenue and TVL of FTM Token
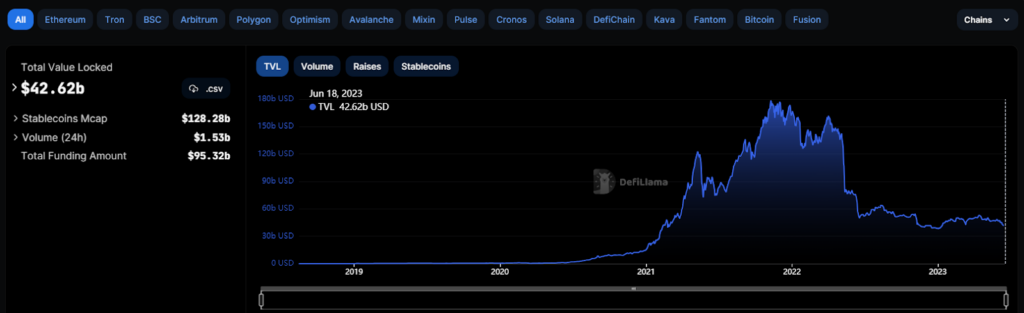
The TVL of the FTM token is seeing a further decline in its value since last May. A decrease in these values indicates that the investors are not confident regarding the token. The present TVL of FTM is 186.55 Million observing a change of -0.78% within the last 24 hours.
A Decline in Revenue and Fees of FTM Token
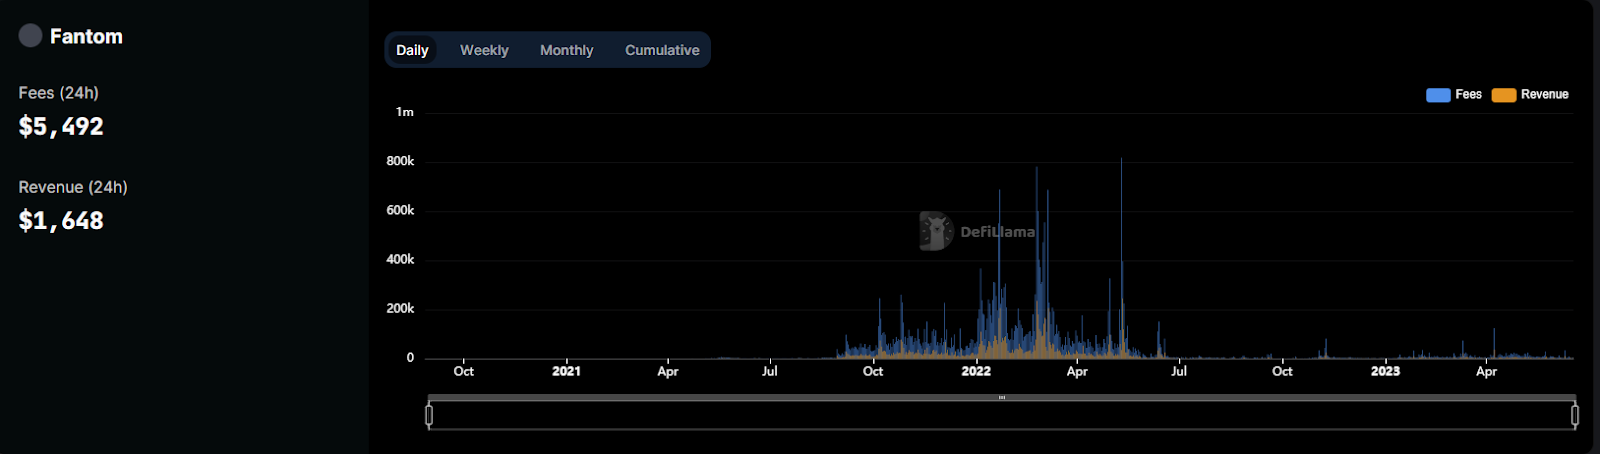
The Fees and Revenue of FTM have also observed a severe decline with TVL. After making its all-time high at $6.97 Million near early January and at present the 1-Day fees accumulated by Fantum are $5,492K and the revenue is $1,648K.
These metrics do not present a positive picture regarding the future token. However, the price action indicates that buyers will not be discouraged by the seller’s superiority within the price.
Technical Analysis On Daily Chart
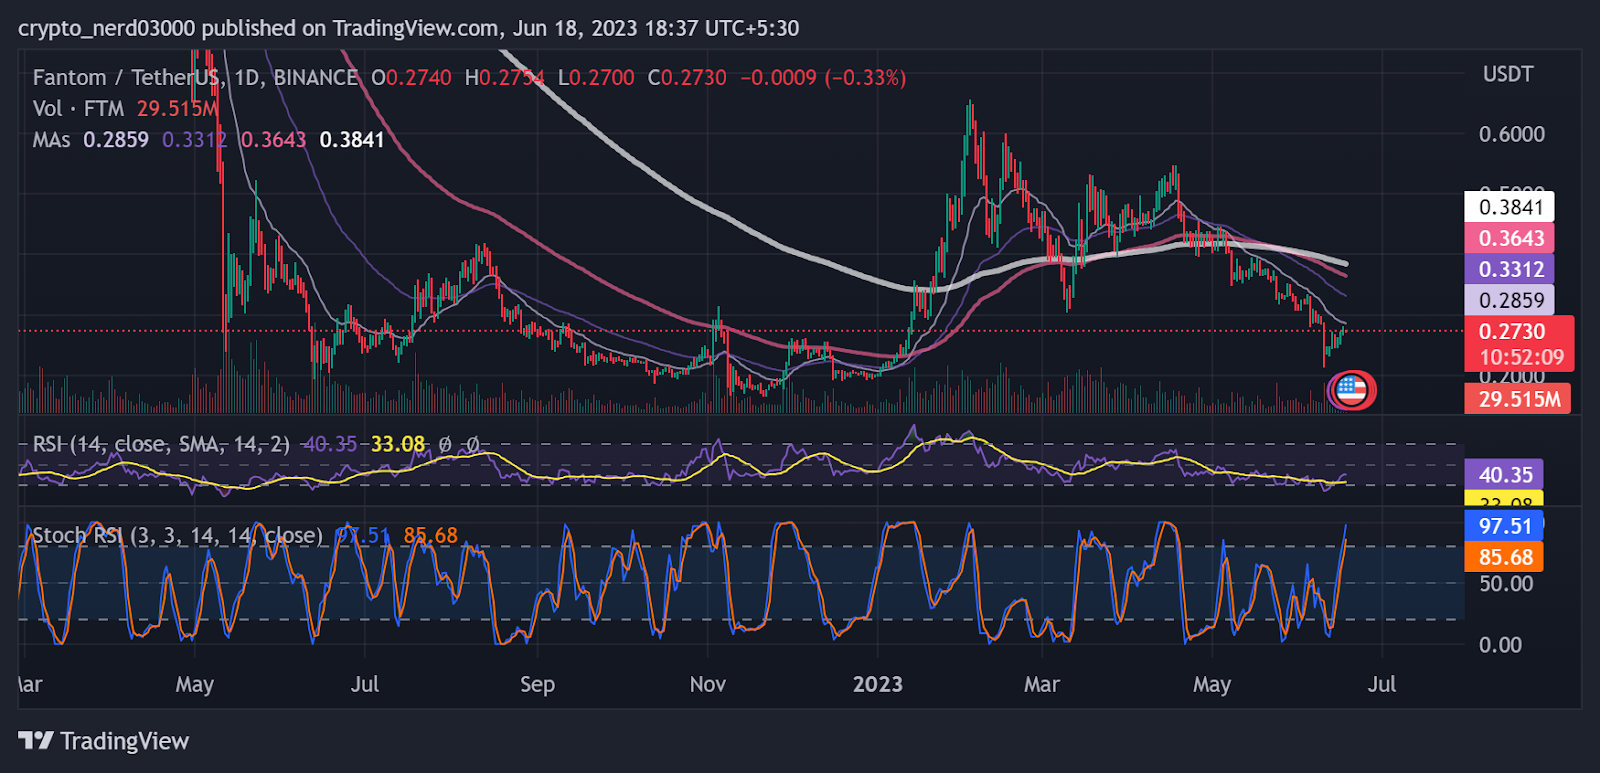
The RSI line recently breached its 14 SMA resistance level; also making a new high breaking its previous lower high and low pattern. The current value of RSI is 39.87 point’s and the current value of 14 SMA is 33.05 points.
At present, the stochastic RSI is presenting a contradictory view from the RSI line. It is moving near the overbought level. The %K is yet to give a negative interception to the %D line. The current value of stochastic RSI is 96.32 points.
Conclusion
The majority of the technical indicators are presenting a contradicting view of the FTM token. Whereas the decline in TVL and Revenue suggests buyers are not very confident regarding the long-term value of the token according to DefiLama.
The price of FTM has been facing constant rejection from the 20 EMA for the past few months. Current price action indicates that the value can see further decline though RSI is positive.
Technical levels –
Support –$2.000
Resistance – $3.000
Disclaimer
The views and opinions stated by the author, or any people named in this article, are for informational purposes only, and they do not establish financial, investment, or other advice. Investing in or trading crypto assets comes with a risk of financial loss.

Andrew is a blockchain developer who developed his interest in cryptocurrencies while pursuing his post-graduation major in blockchain development. He is a keen observer of details and shares his passion for writing, along with coding. His backend knowledge about blockchain helps him give a unique perspective to his writing skills, and a reliable craft at explaining the concepts such as blockchain programming, languages and token minting. He also frequently shares technical details and performance indicators of ICOs and IDOs.


